Diabetes: regional descriptives
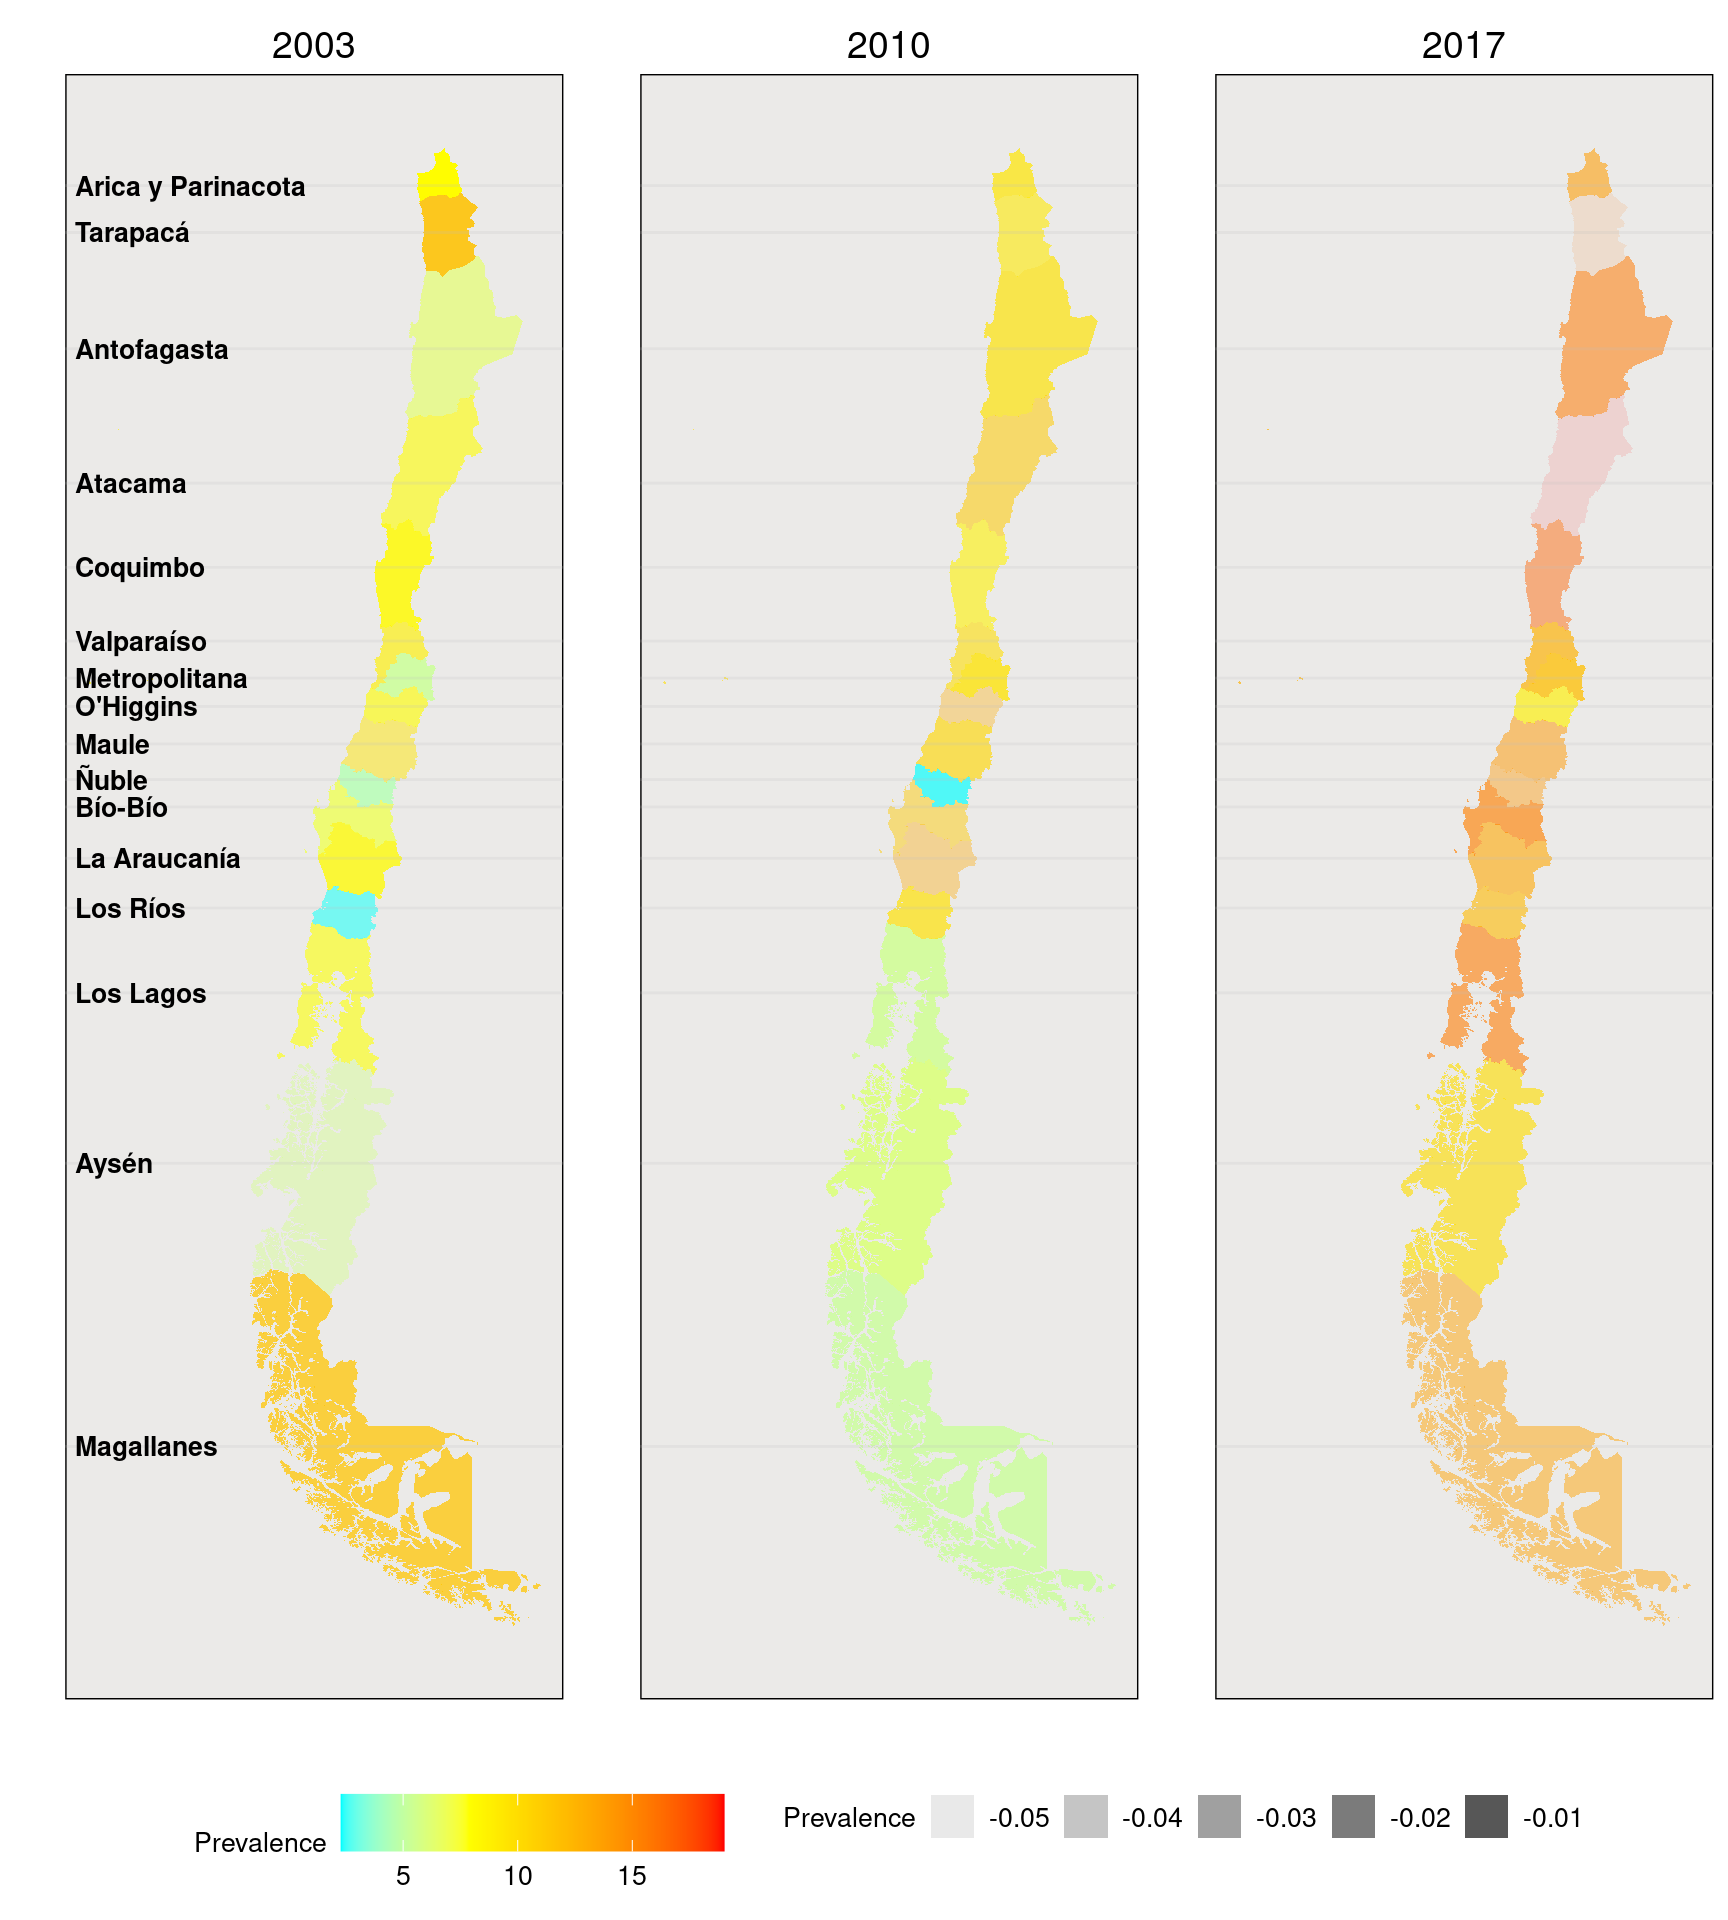
Figure 1: Prevalence by geographical location. Chile, ENS 2003-2010-2017
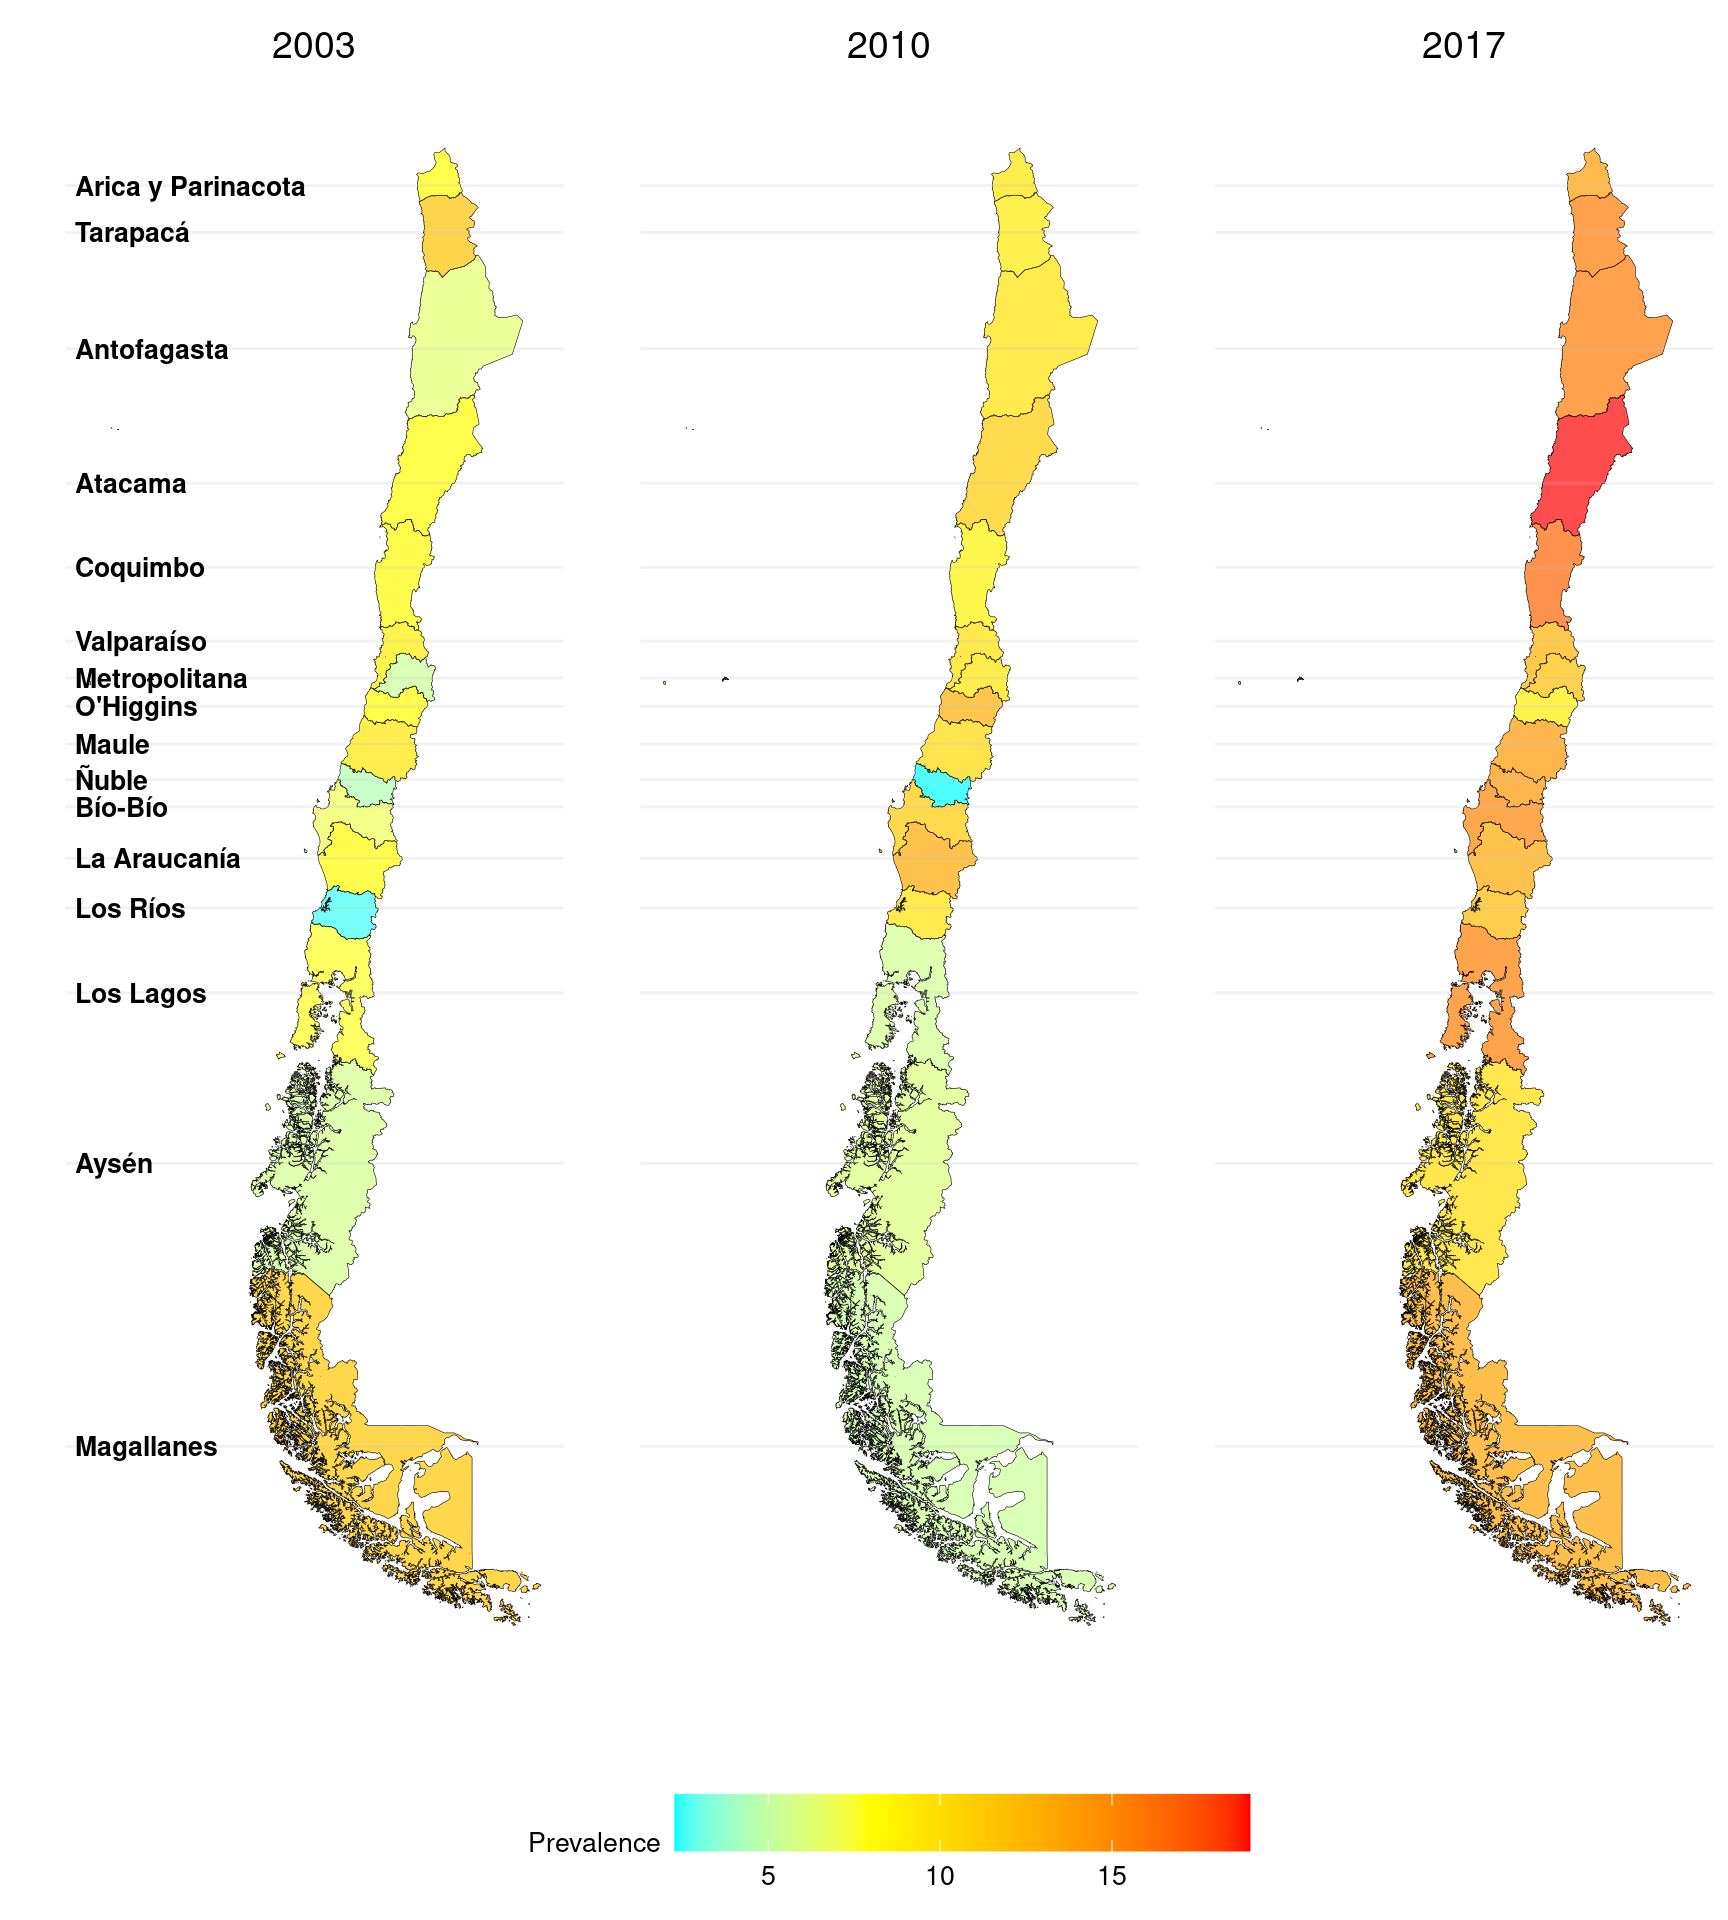
Note: Do not assume that the geographies mapped in different colors have significantly different rates. Estimates are grouped in categories by various methods to produce a map. The grouping does not incorporate standard deviation or confidence intervals and does not imply any formal comparisons between geographic units.
Figure 2: Prevalence and 95% confidence interval by geographical location. Chile, ENS 2003-2010-2017
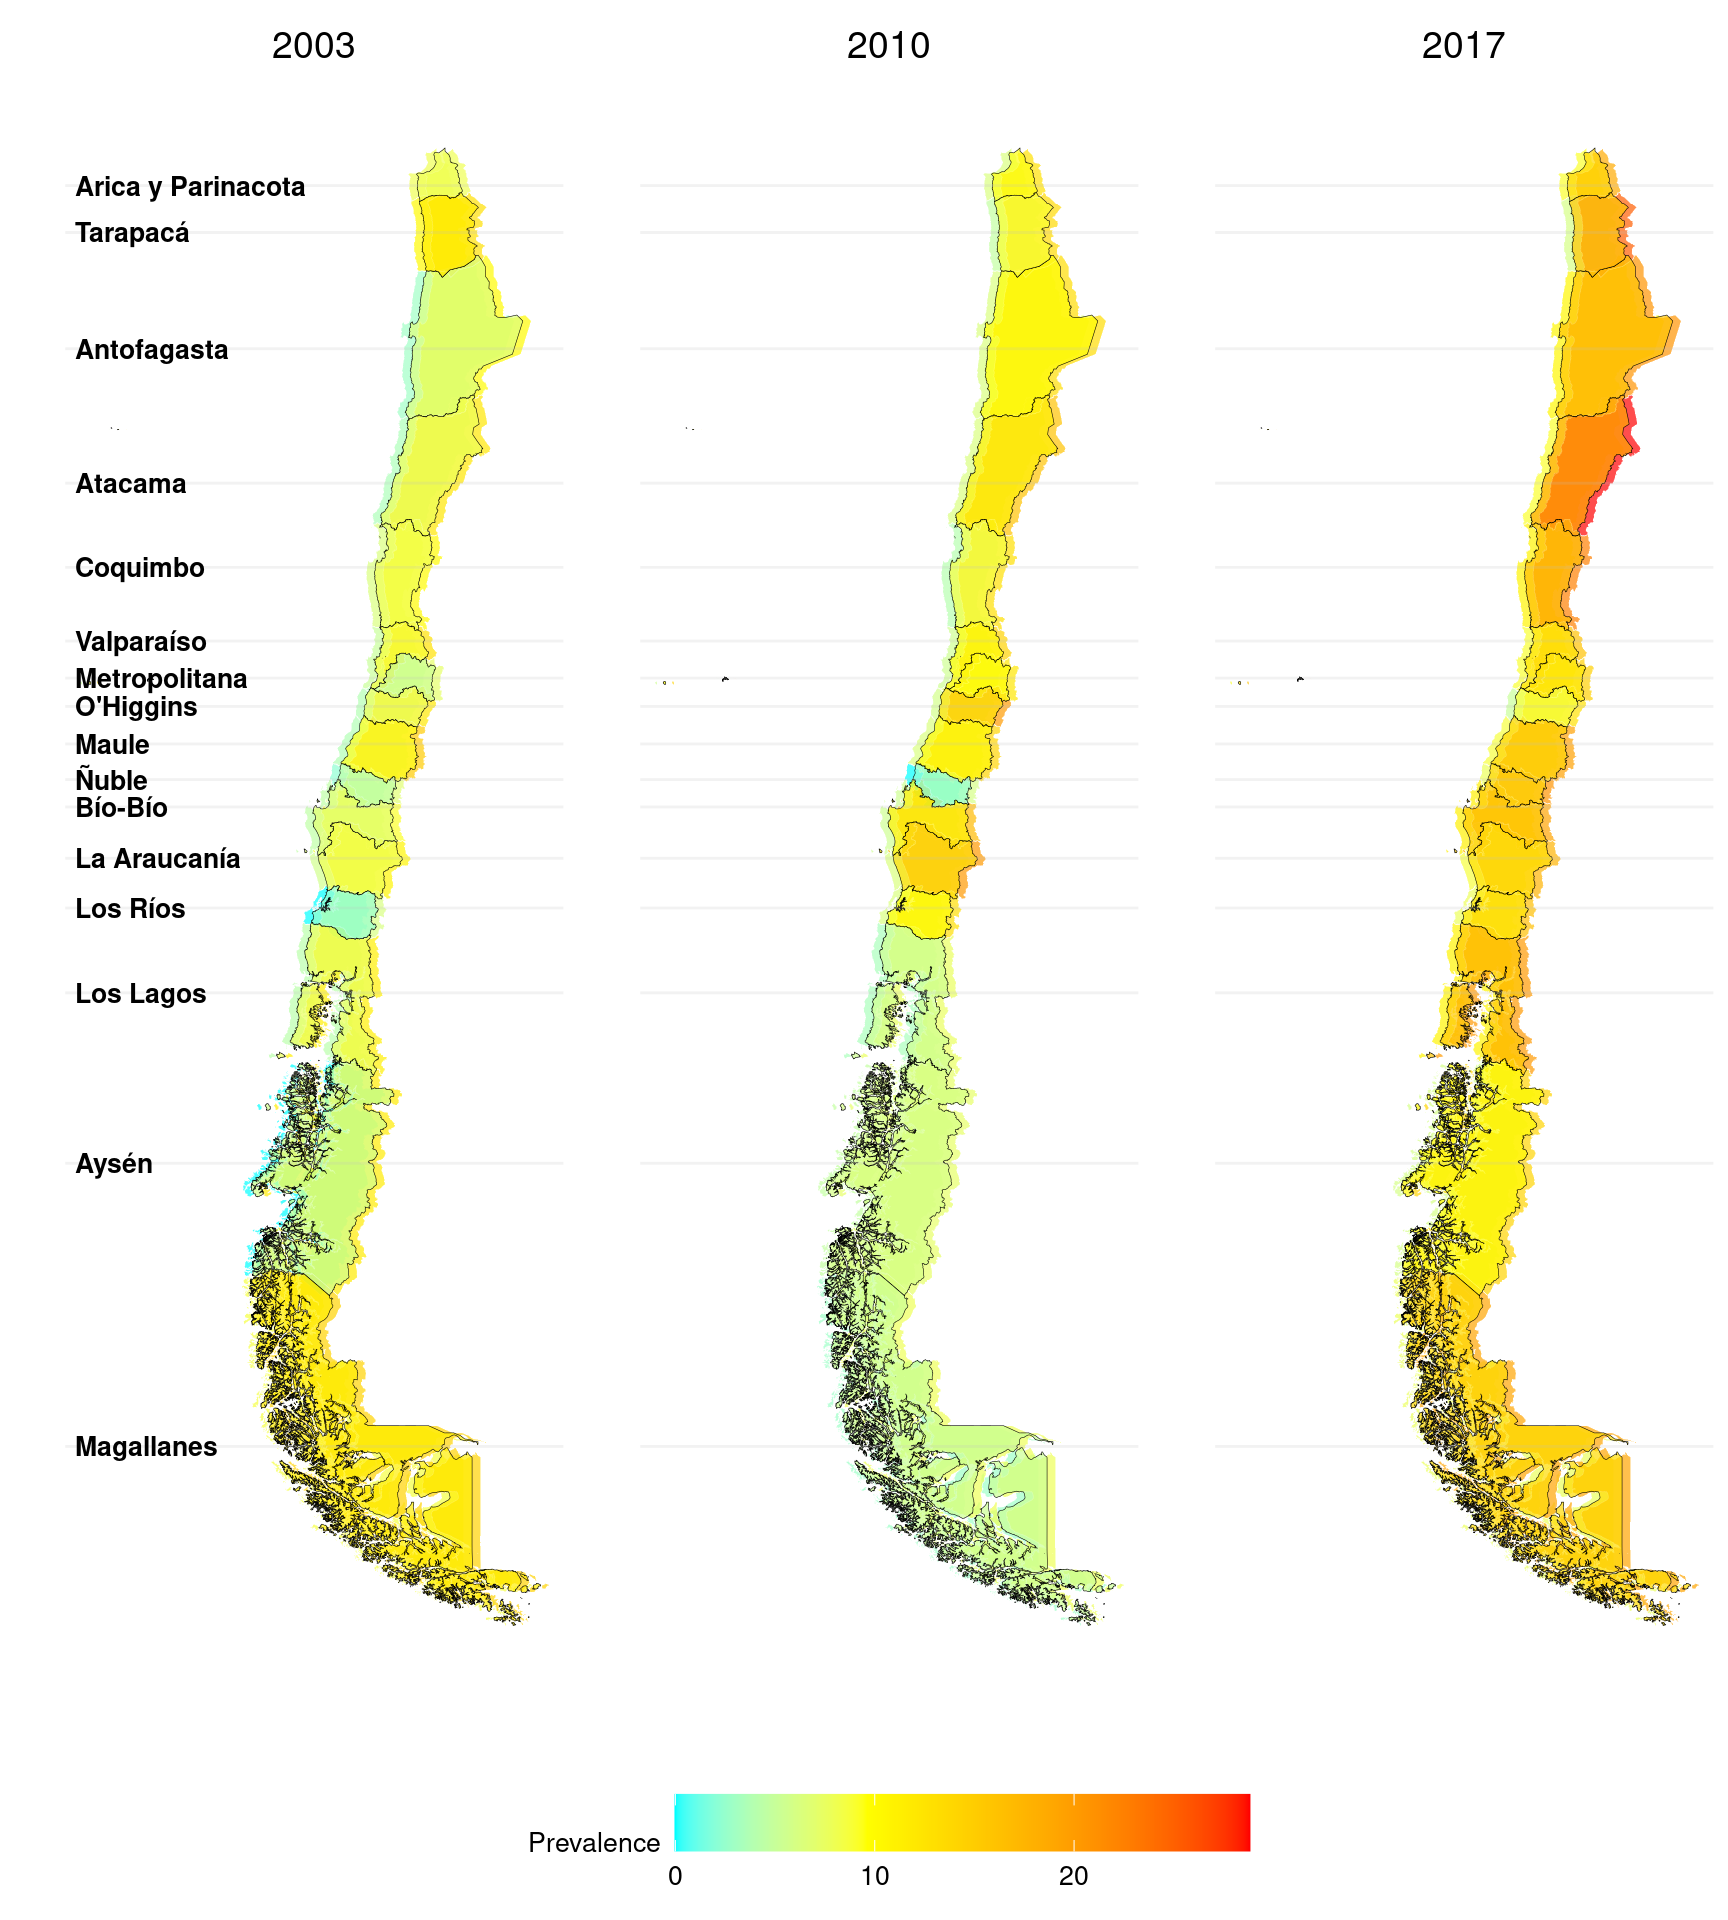 Note: Do not assume that the geographies mapped in different colors have significantly different rates. Estimates are grouped in categories by various methods to produce a map. The grouping does not imply any formal comparisons between geographic units.
Figure 3: Prevalence and standard deviation by geographical location. Chile, ENS 2003-2010-2017
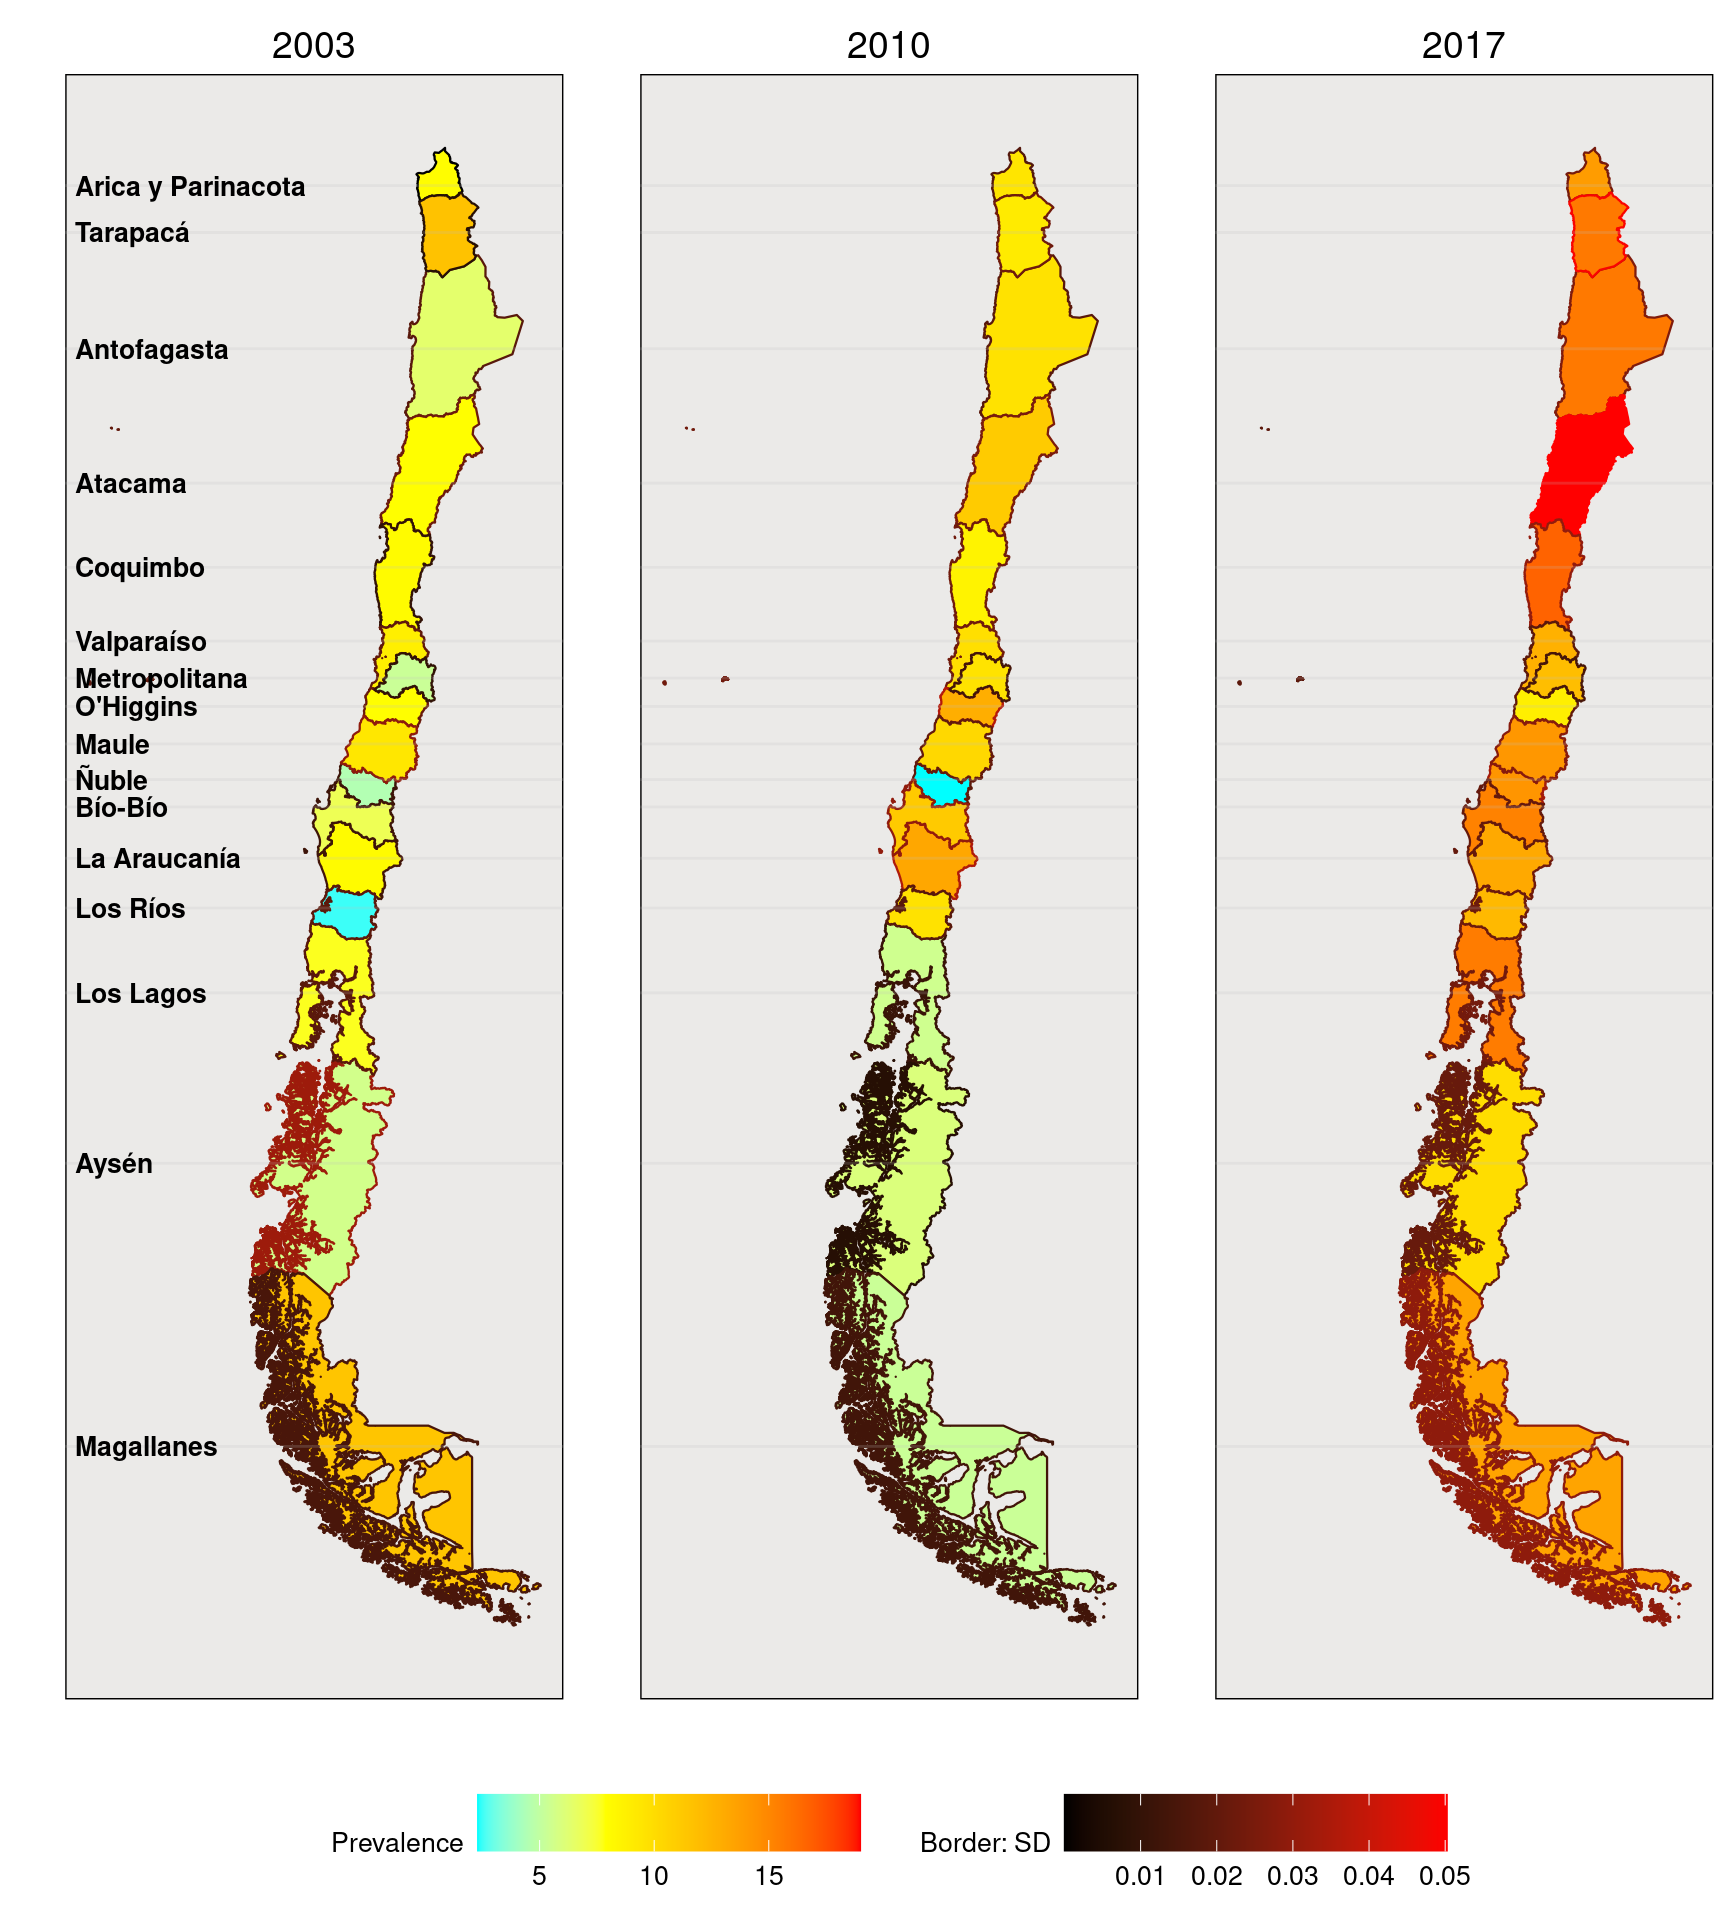
Figure 4: Prevalence and standard deviation by geographical location. Chile, ENS 2003-2010-2017
 ### Figure 1: Awareness by geographical location. Chile, ENS 2003-2010-2017
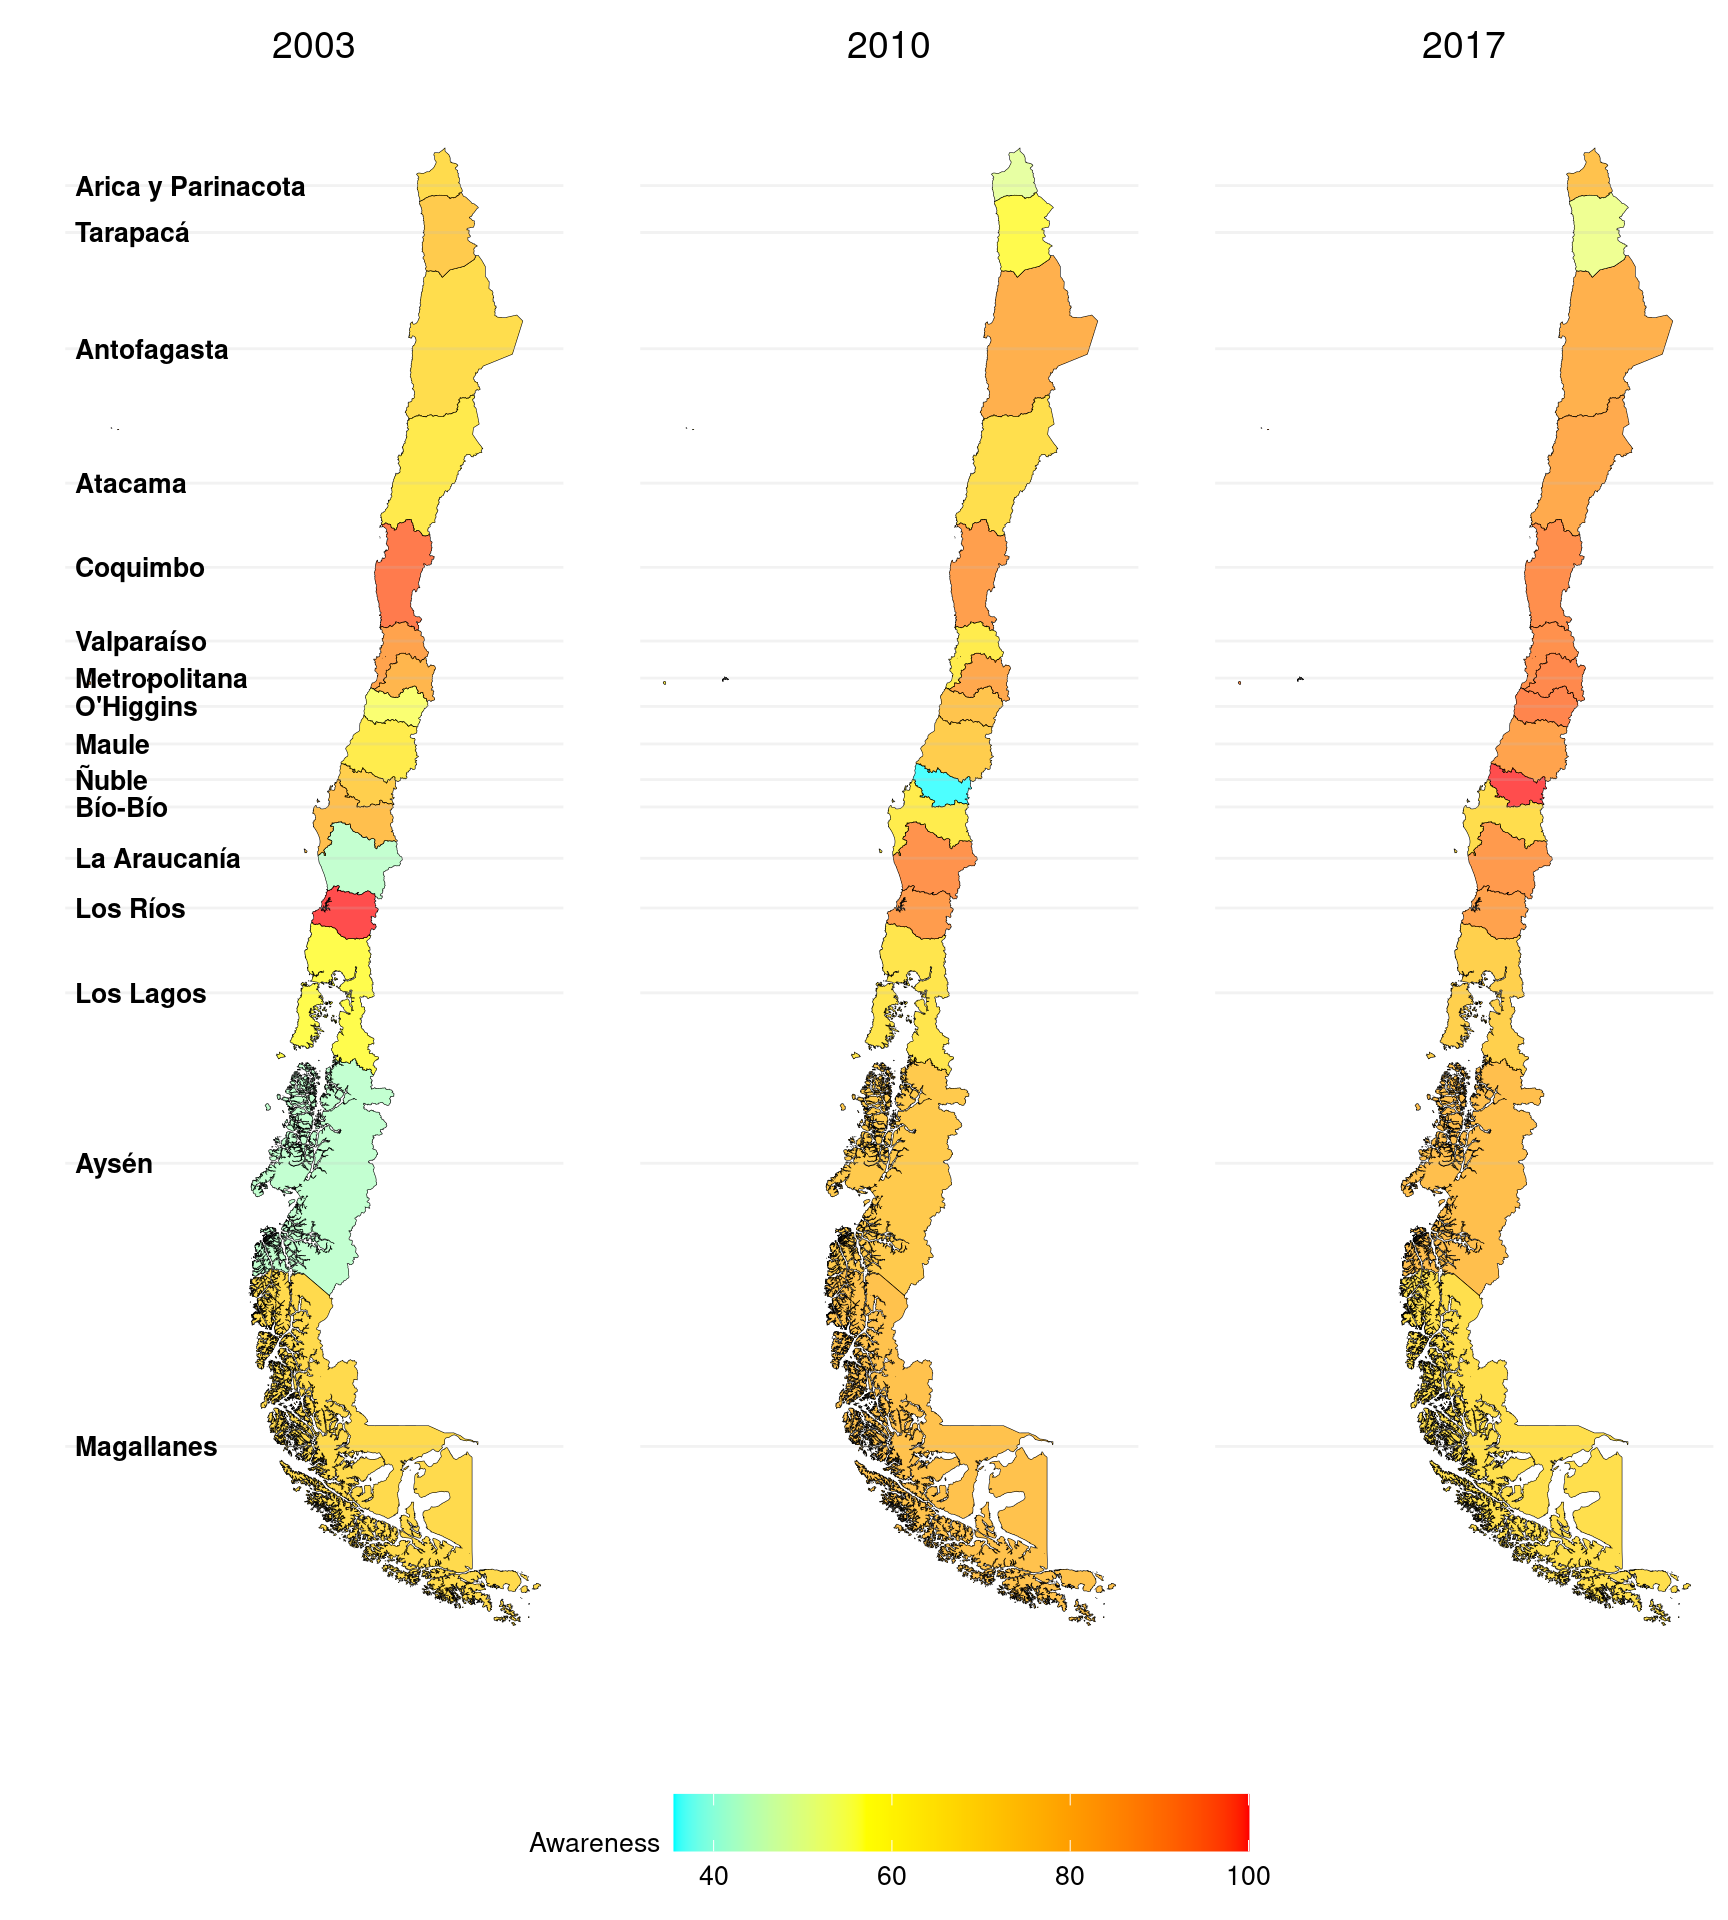
Figure 1: Treatment by geographical location. Chile, ENS 2003-2010-2017
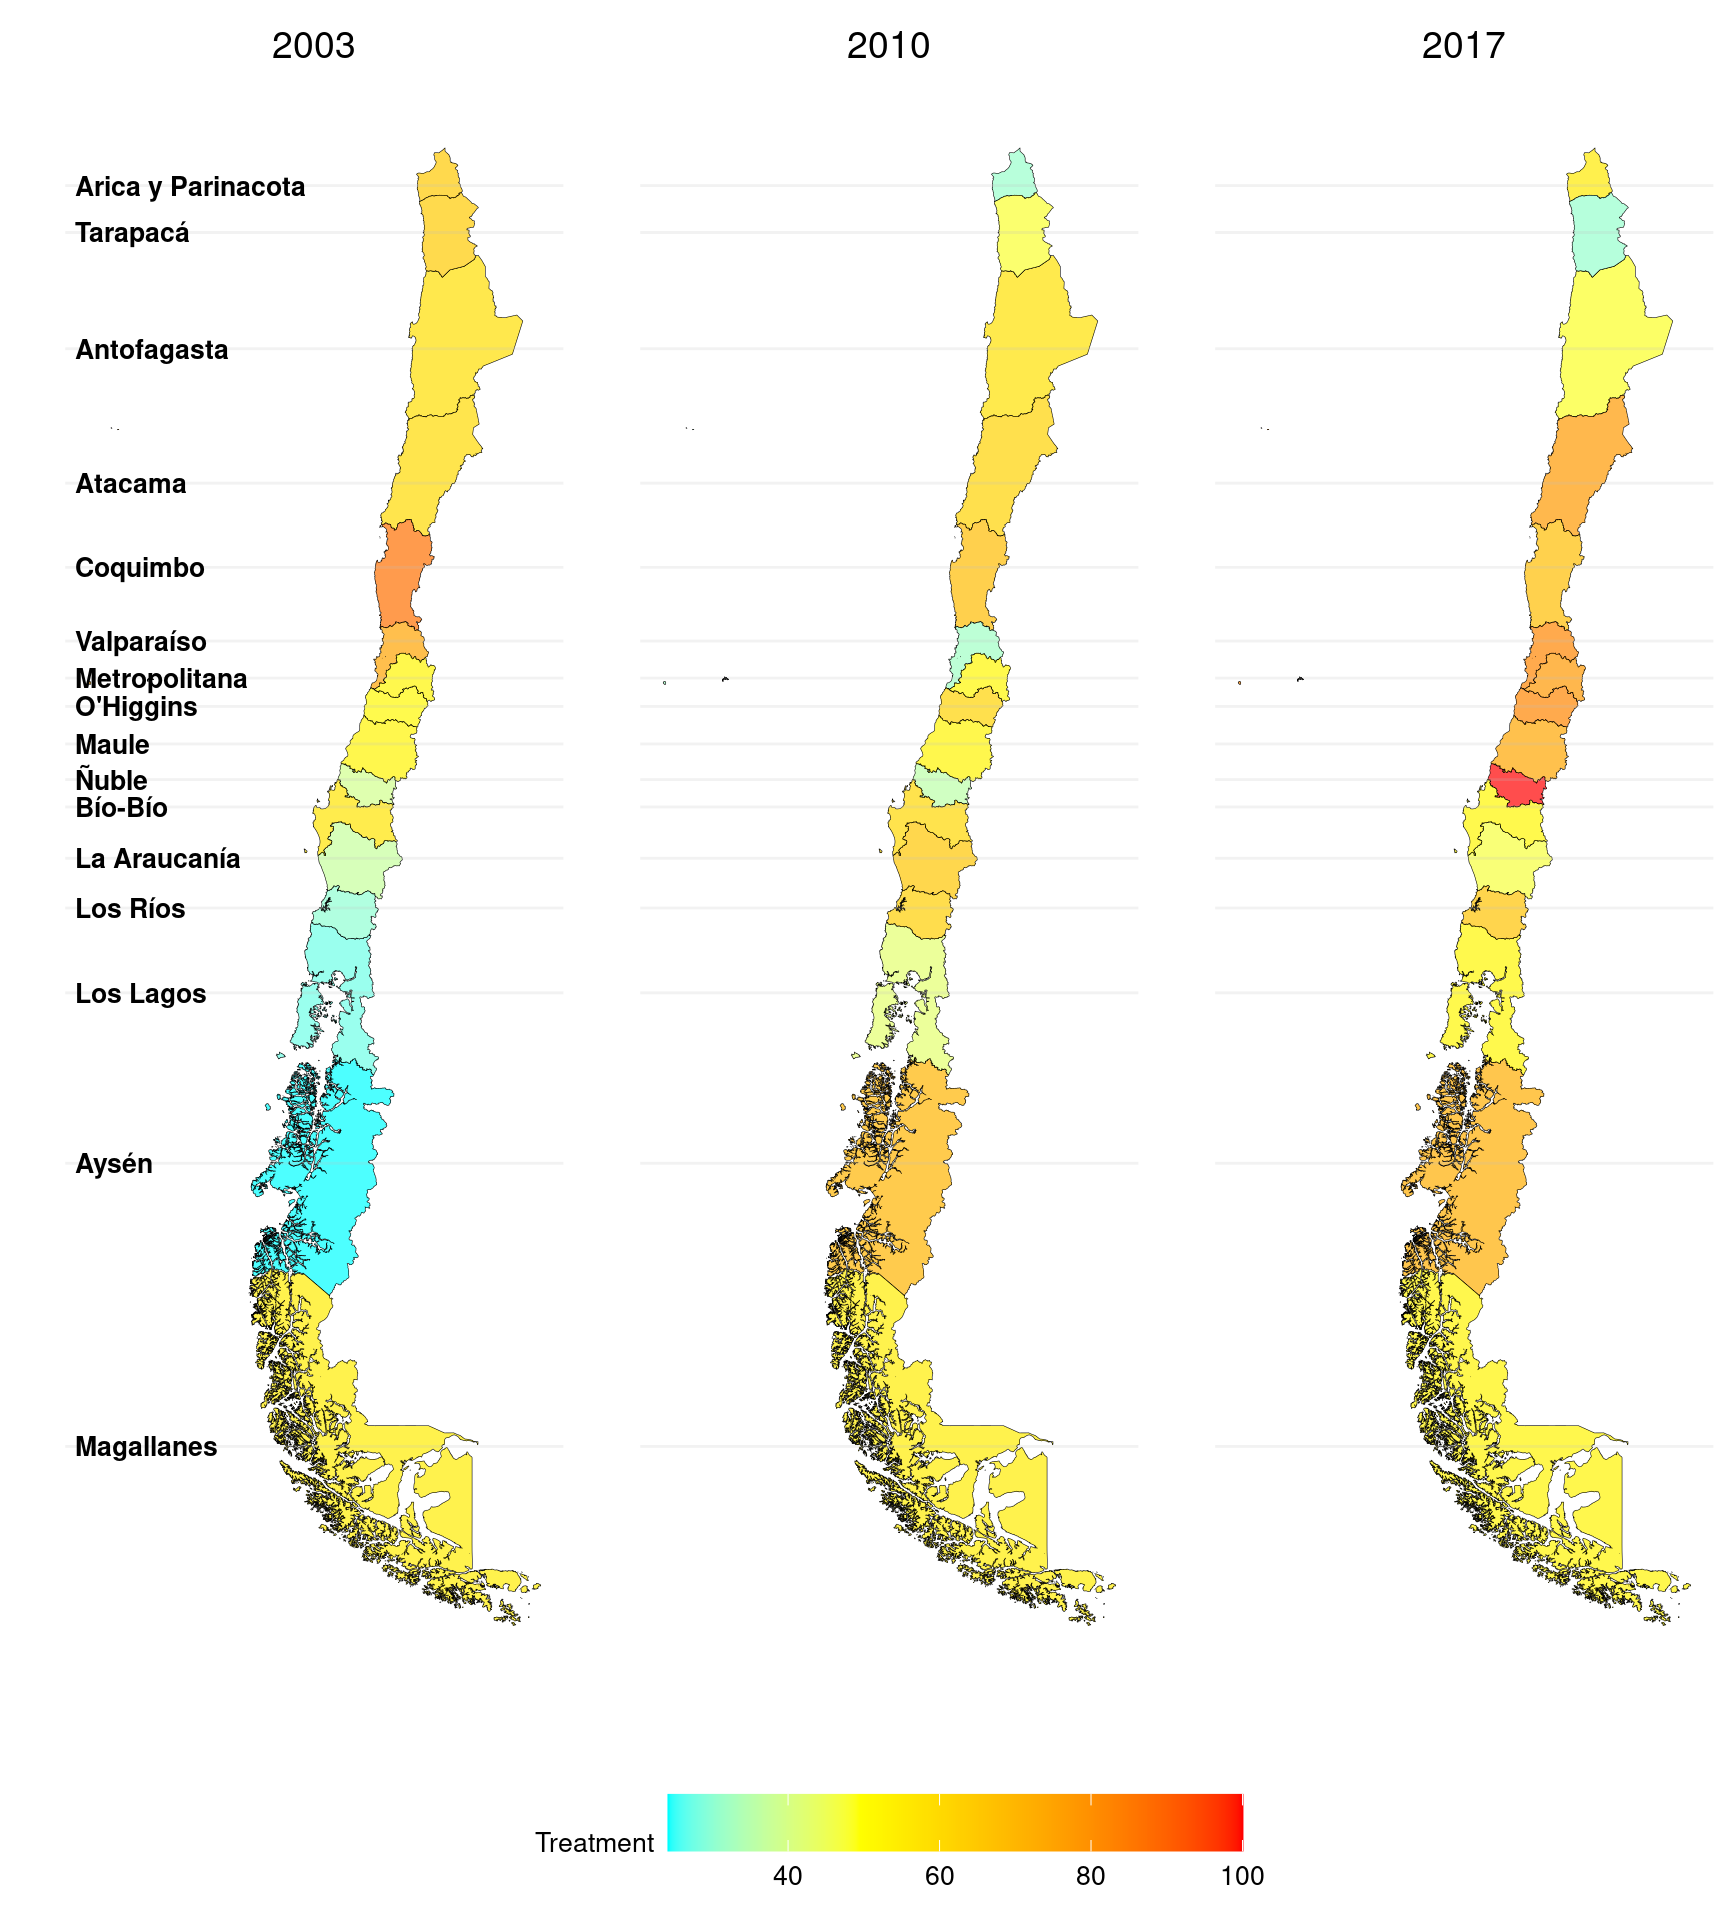
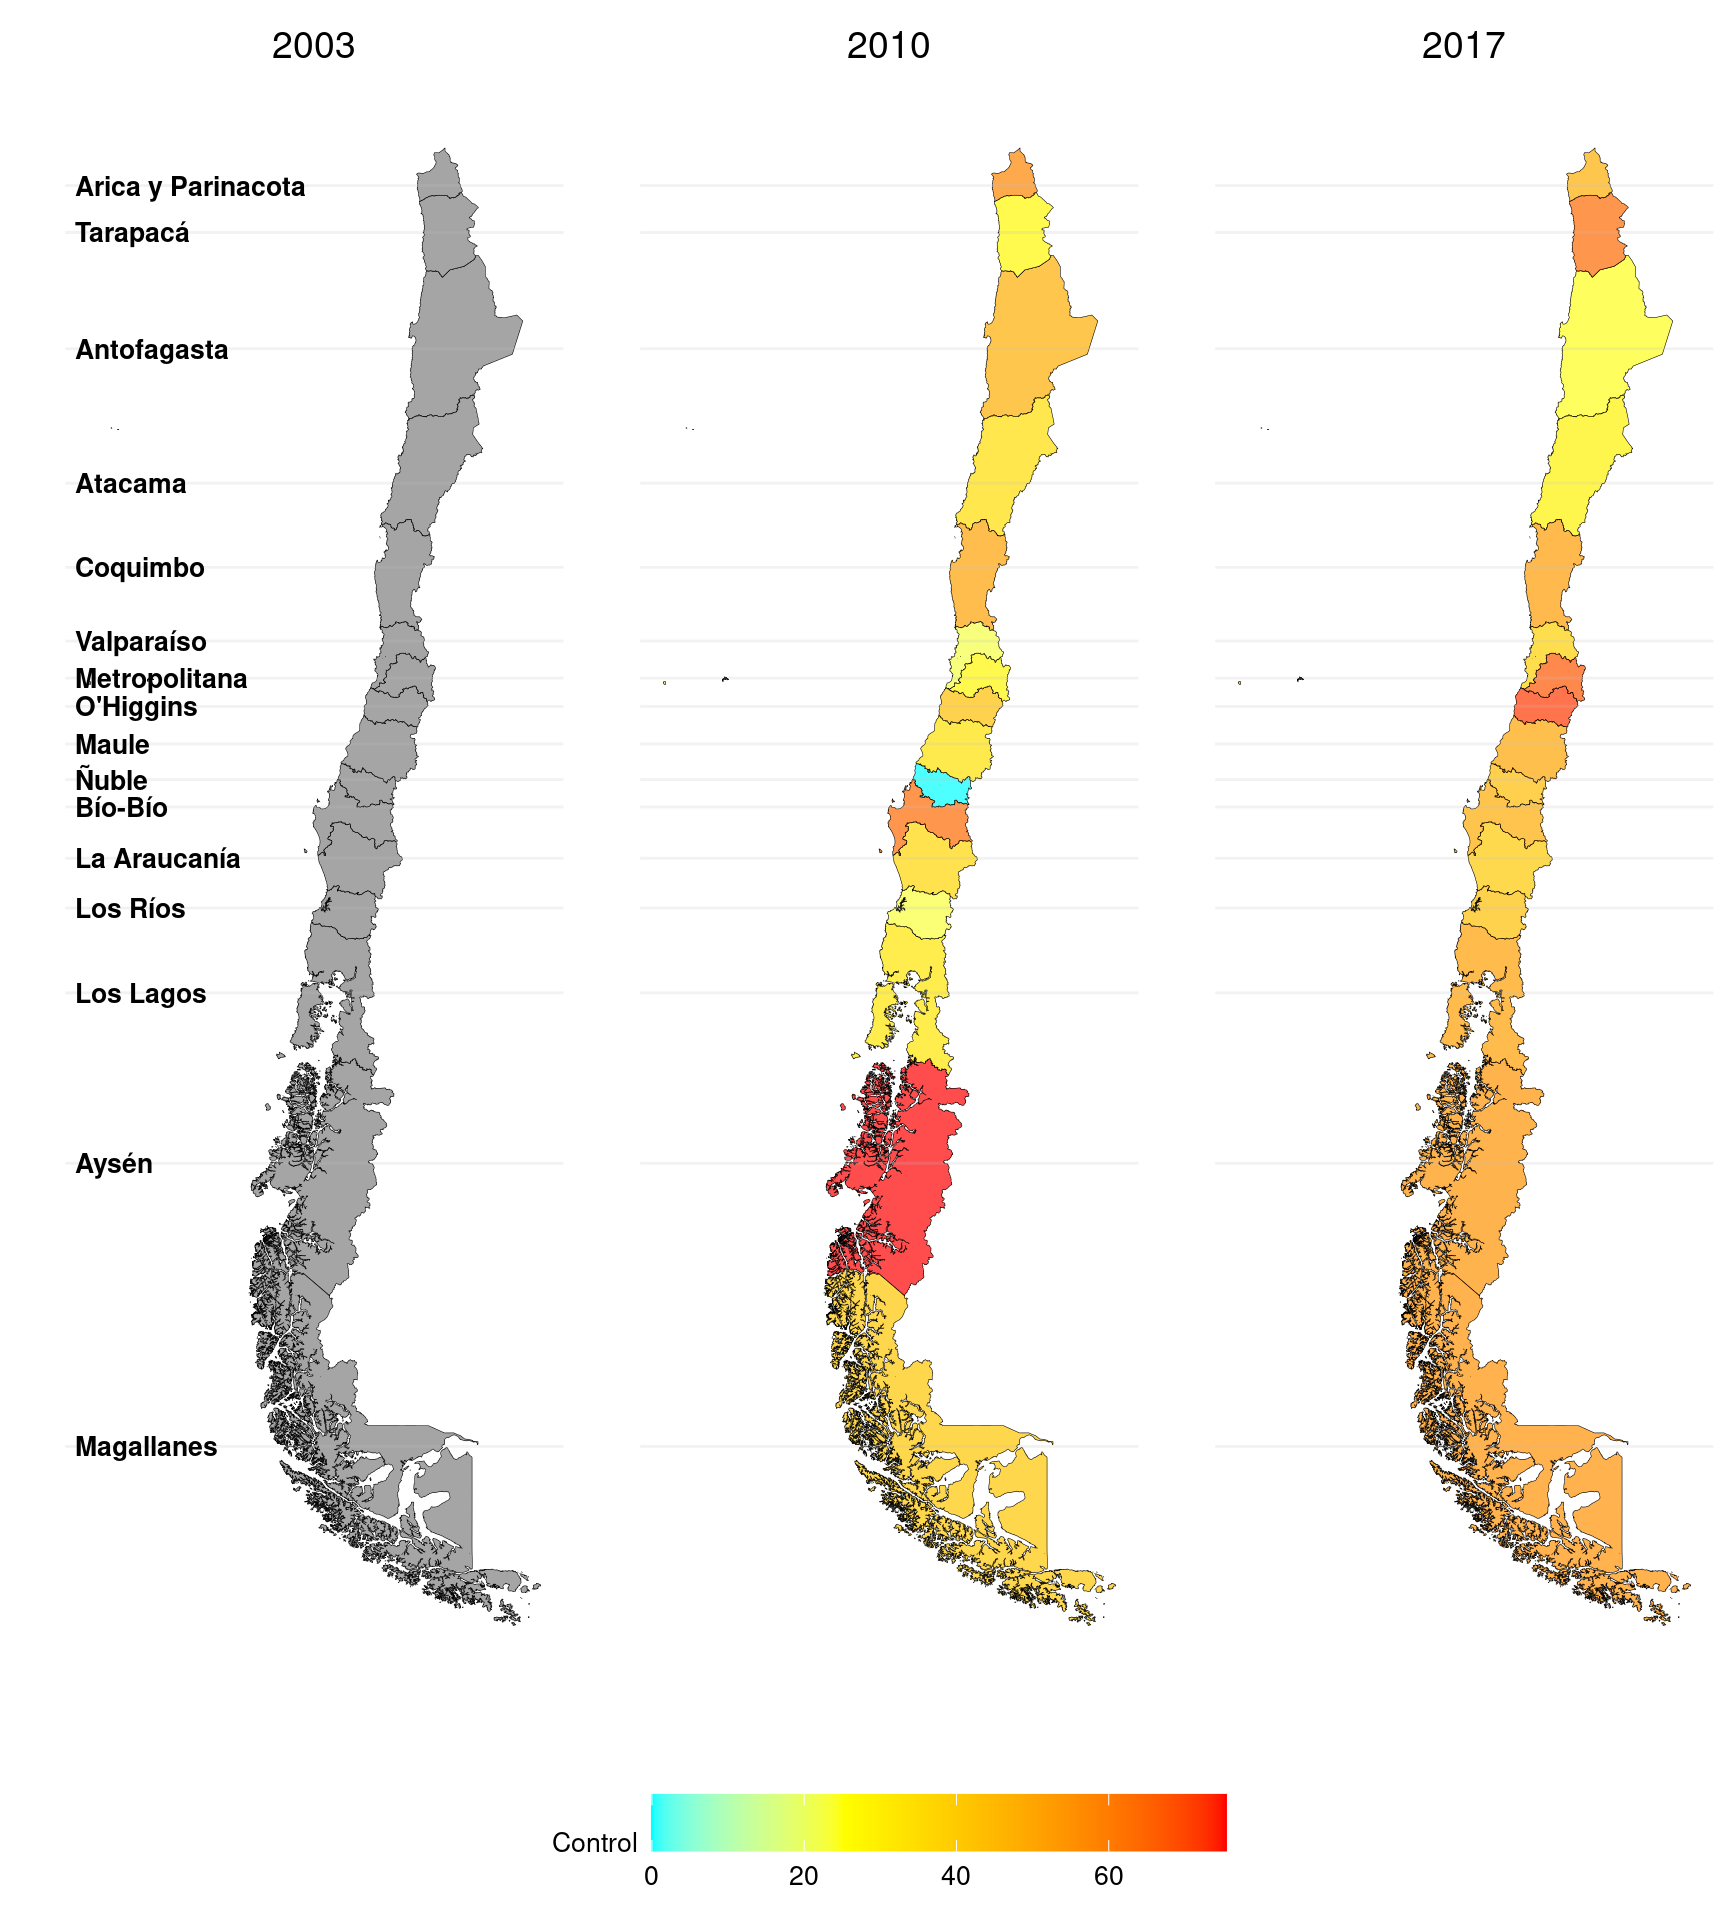
Figure 1: Control by geographical location. Chile, ENS 2010-2017