Diabetes care cascade in Chile
Diabetes care cascade in Chile: a serial cross-sectional study of national health surveys 2003-2010-2017
Sample characteristics
Response rates for the total sample were 63%, 75% and 67% in 2003, 2010 and 2017 respectively. Overall, 3614, 5267 and 6074 adults took part in the ENS 2003, 2010, and 2017 surveys, respectively. Of these, 3448 (95%), 4863 (92%) and 5379 (86%) adults took part in the nurse visit and 3187,4663 and 4862 had valid blood glucose level.
Figure 1: Flow diagram of participants in the study, National Health Survey, Chile, 2003–2010-2017
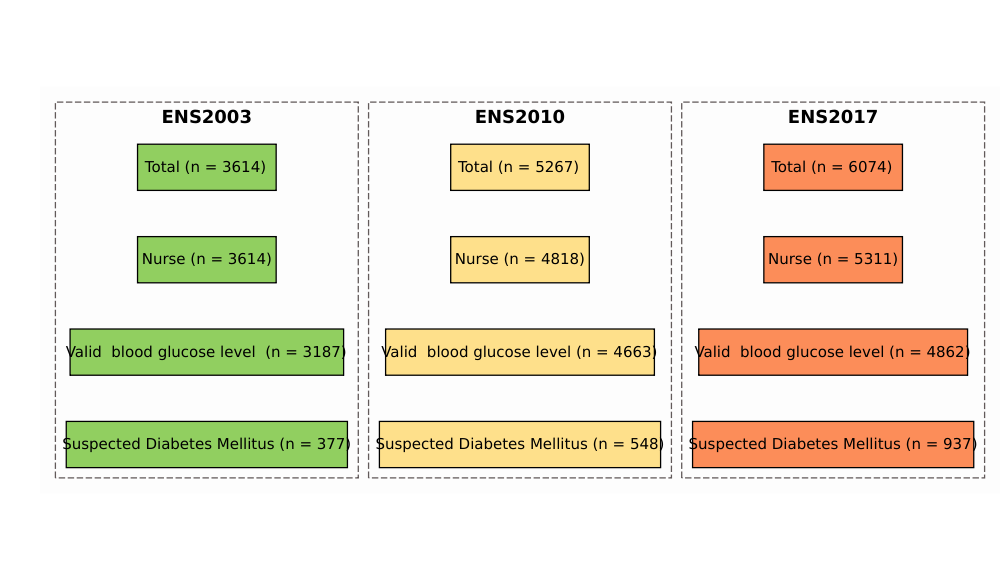
Table 1: shows the sociodemographic profile and average levels of YY in each survey year amongst the ZZZ participants aged 17 years or over with valid YY and medicine data. Characteristics were similar across the three surveys, with the exception of an increase over time in the proportion of participants in the highest educational group (>12 years of formal education).
Table 1: Descriptive of participants in the study, National Health Survey, Chile, 2003–2010-2017
Diabetes and its care cascade (awareness, treatment and control)
Figure 2: shows the levels of Diabetes and levels of attainment at each care cascade step (awareness, treatment, and control) across the three surveys. The estimates and accompanying 95% confidence intervals (95% CI) are provided as supplementary data (Additional file 1: Table S1). For brevity, we report here on the change between the first- and last-surveys (i.e. 2003 and 2017). Among all adults, Diabetes prevalence decreased slightly from 6.8 % (95% CI: 5.7 - 7.8) 13.1 % (95% CI: 11.7 - 14.5). Diabetes prevalence decreased among males from % (95% CI: - ) to % (95% CI: - ) and decreased among females from % (95% CI: - ) to % (95% CI: - ).
Figure 2: Diabetes prevalence, awareness, treatment and control by gender. Chile ENS2003-2010-2017
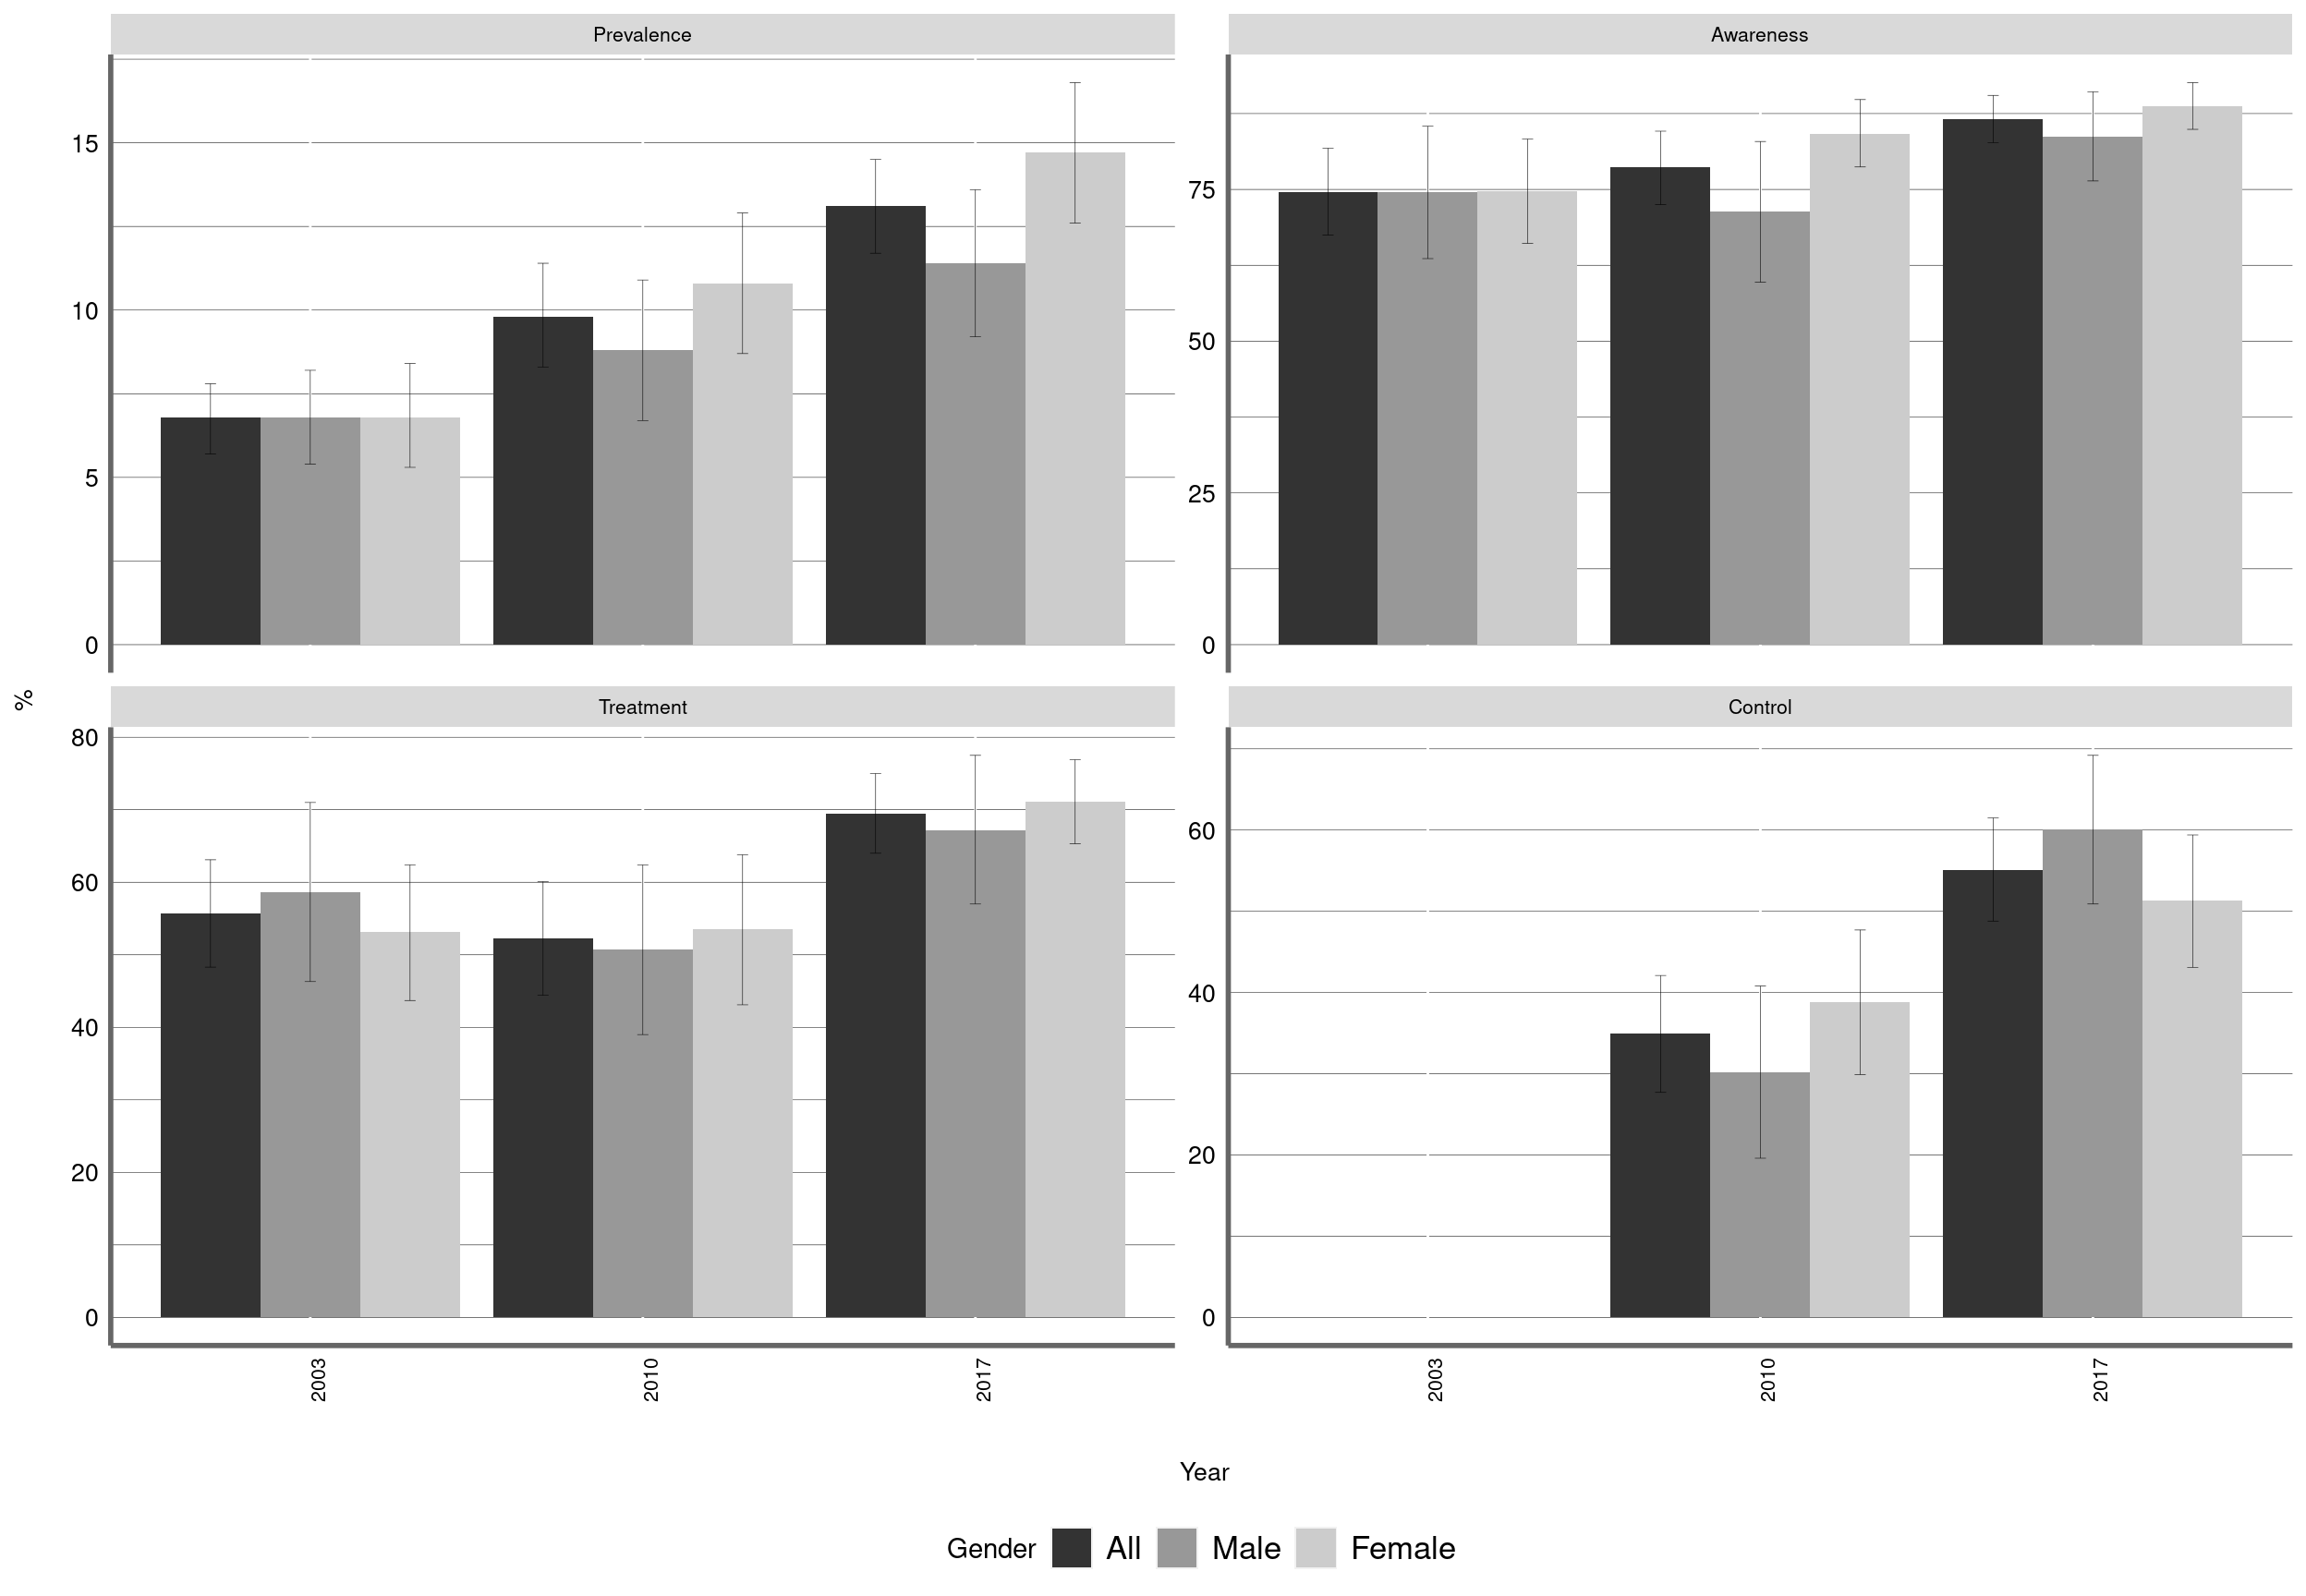
Definitions according to the xxx guideline. Prevalence: blood glucosa>=126 mg/dl or self-reported medical diagnosis of diabetes mellitus; Awareness: prior diagnosis of diabetes mellitus; Treatment: current use of medication for the treatment of diabetes according to ATC codes; and Control: Glycated hemoglobin<7%. Levels of Diabetes estimated among all adults. Levels of awareness, treatment and control estimated amongst those classified as Diabetic.
Among those classified as Diabetic, attainment at each cascade step mainly showed improvement. Levels of treated- and controlled-Diabetes were significantly higher in 2017 than in 2003 (65% versus 41% for treatment, P < 0.001; 34% versus 14% for control, P < 0.001), while levels of awareness were stable (66% versus 59%, P = 0.130) (Figure 1; Additional file 1: Table S1). Trends were similar by gender. First, levels of awareness among males increased from 45.6% (95% CI: 39.9-51.4%) to 58.1% (95% CI: 52.2-63.8%); levels were higher among females but remained stable at around 73%. Second, levels of treatment among males increased from 24.3% (95% CI: 19.9-29.3%) to 56.7% (95% CI: 50.9-62.4%) and increased among females from 54.9% (95% CI: 49.5-60.1%) to 73.5% (95% CI: 68.4-78.0%). Third, levels of controlled Diabetes among males increased from 6.3% (95% CI: 3.8-10.3%) to 28.2% (95% CI: 23.0-33.9%) and increased among females from 19.9% (95% CI: 15.9-24.7%) to 39.7% (95% CI: 34.7-45.0%).
Age-adjusted trends in Diabetes and its cascade of care
Figure 2 shows the age-adjusted trends in Diabetes and in attainment at each cascade step by gender based on logistic regression models. Estimates and accompanying 95% CIs are provided as supplementary data (Additional file 1: Table S2). Among males, the odds of Diabetes decreased significantly between 2003 and 2010 (OR: 0.63; 95% CI: 0.48-0.83) and between 2010 and 2017 (OR: 0.77; 95% CI: 0.59-1.00). The odds of Diabetes decreased for females between 2010 and 2017 (OR: 0.73; 95% CI: 0.57-0.92). In a pooled analysis, the odds of Diabetes were significantly lower for females than for males (OR: 0.73; 95% CI: 0.64-0.84, P <0.001) (Additional file 1: Table S3).
Age adjusted trends for the prevalence and management of Diabetes by gender. Chile ENS2003-2010-2017
Figure 3: Trends for Diabetes prevalence, awareness, treatment and control by gender. Chile ENS2003-2010-2017
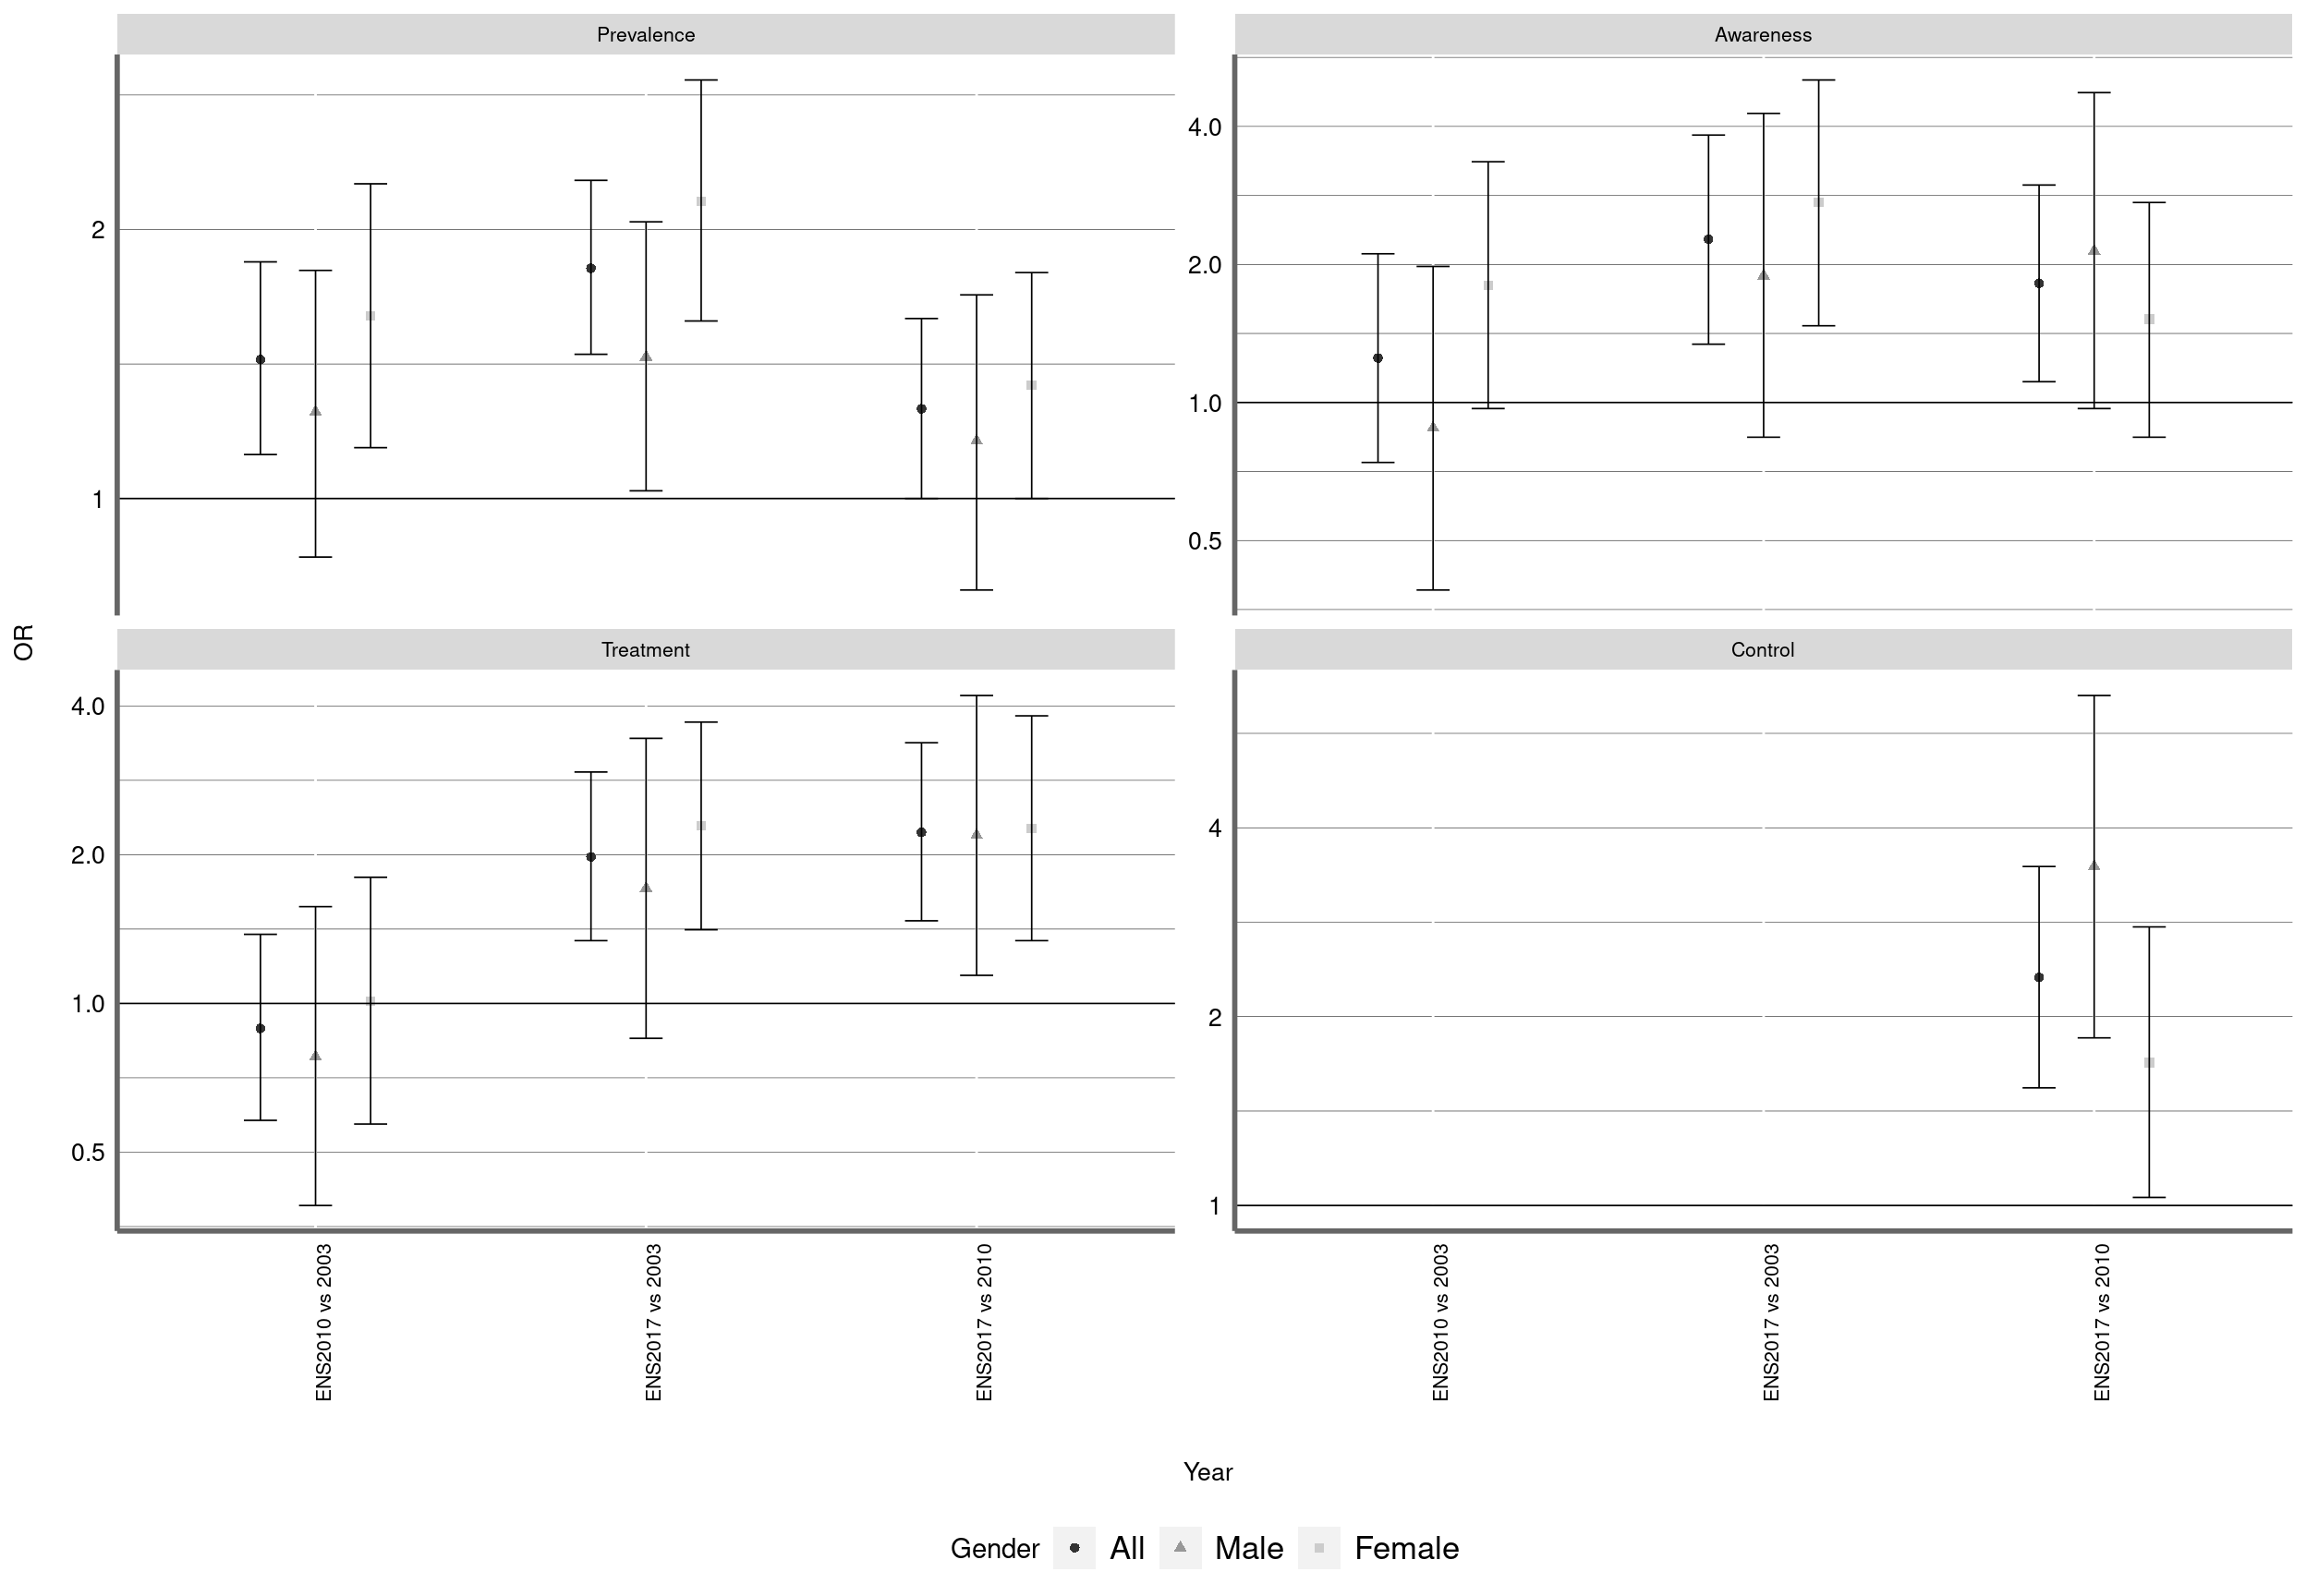
*Odds ratios from age-adjusted logistic regression. Definitions according to the xxx guideline. Prevalence: SBP/DBP ≥140/90 mmHg or current use of antiDiabetic treatment; Awareness: prior diagnosis of high blood pressure; Treatment: current use of antiDiabetic medication according to ATC codes; and Control: SBP/DBP<140/90 mmHg. Odds of Diabetes estimated among all adults. Odds of awareness, treatment and control estimated amongst those classified as Diabetic.
Amongst those classified as Diabetic, the odds of awareness did not change significantly over time, except among males, where the odds increased from 2003 to 2010 (OR: 1.45; 95% CI: 1.02-2.06). Compared with 2003, the odds of treatment and control were significantly higher in 2010 and in 2017 for both genders (Figure 2; Additional file 1: Table S2). In a pooled analysis, the age-adjusted odds of awareness (OR: 2.27; 95% CI: 1.86-2.77, P < 0.001), treatment (OR: 2.53; 95% CI: 2.07-3.09, P < 0.001) and control (OR: 3.53; 95% CI: 2.63-4.73, P < 0.001) were significantly higher for females than for males (Additional file 1: Table S3).
Figure 4: Prevalence and management of Diabetes by age. Chile, ENS2003-2010-2017
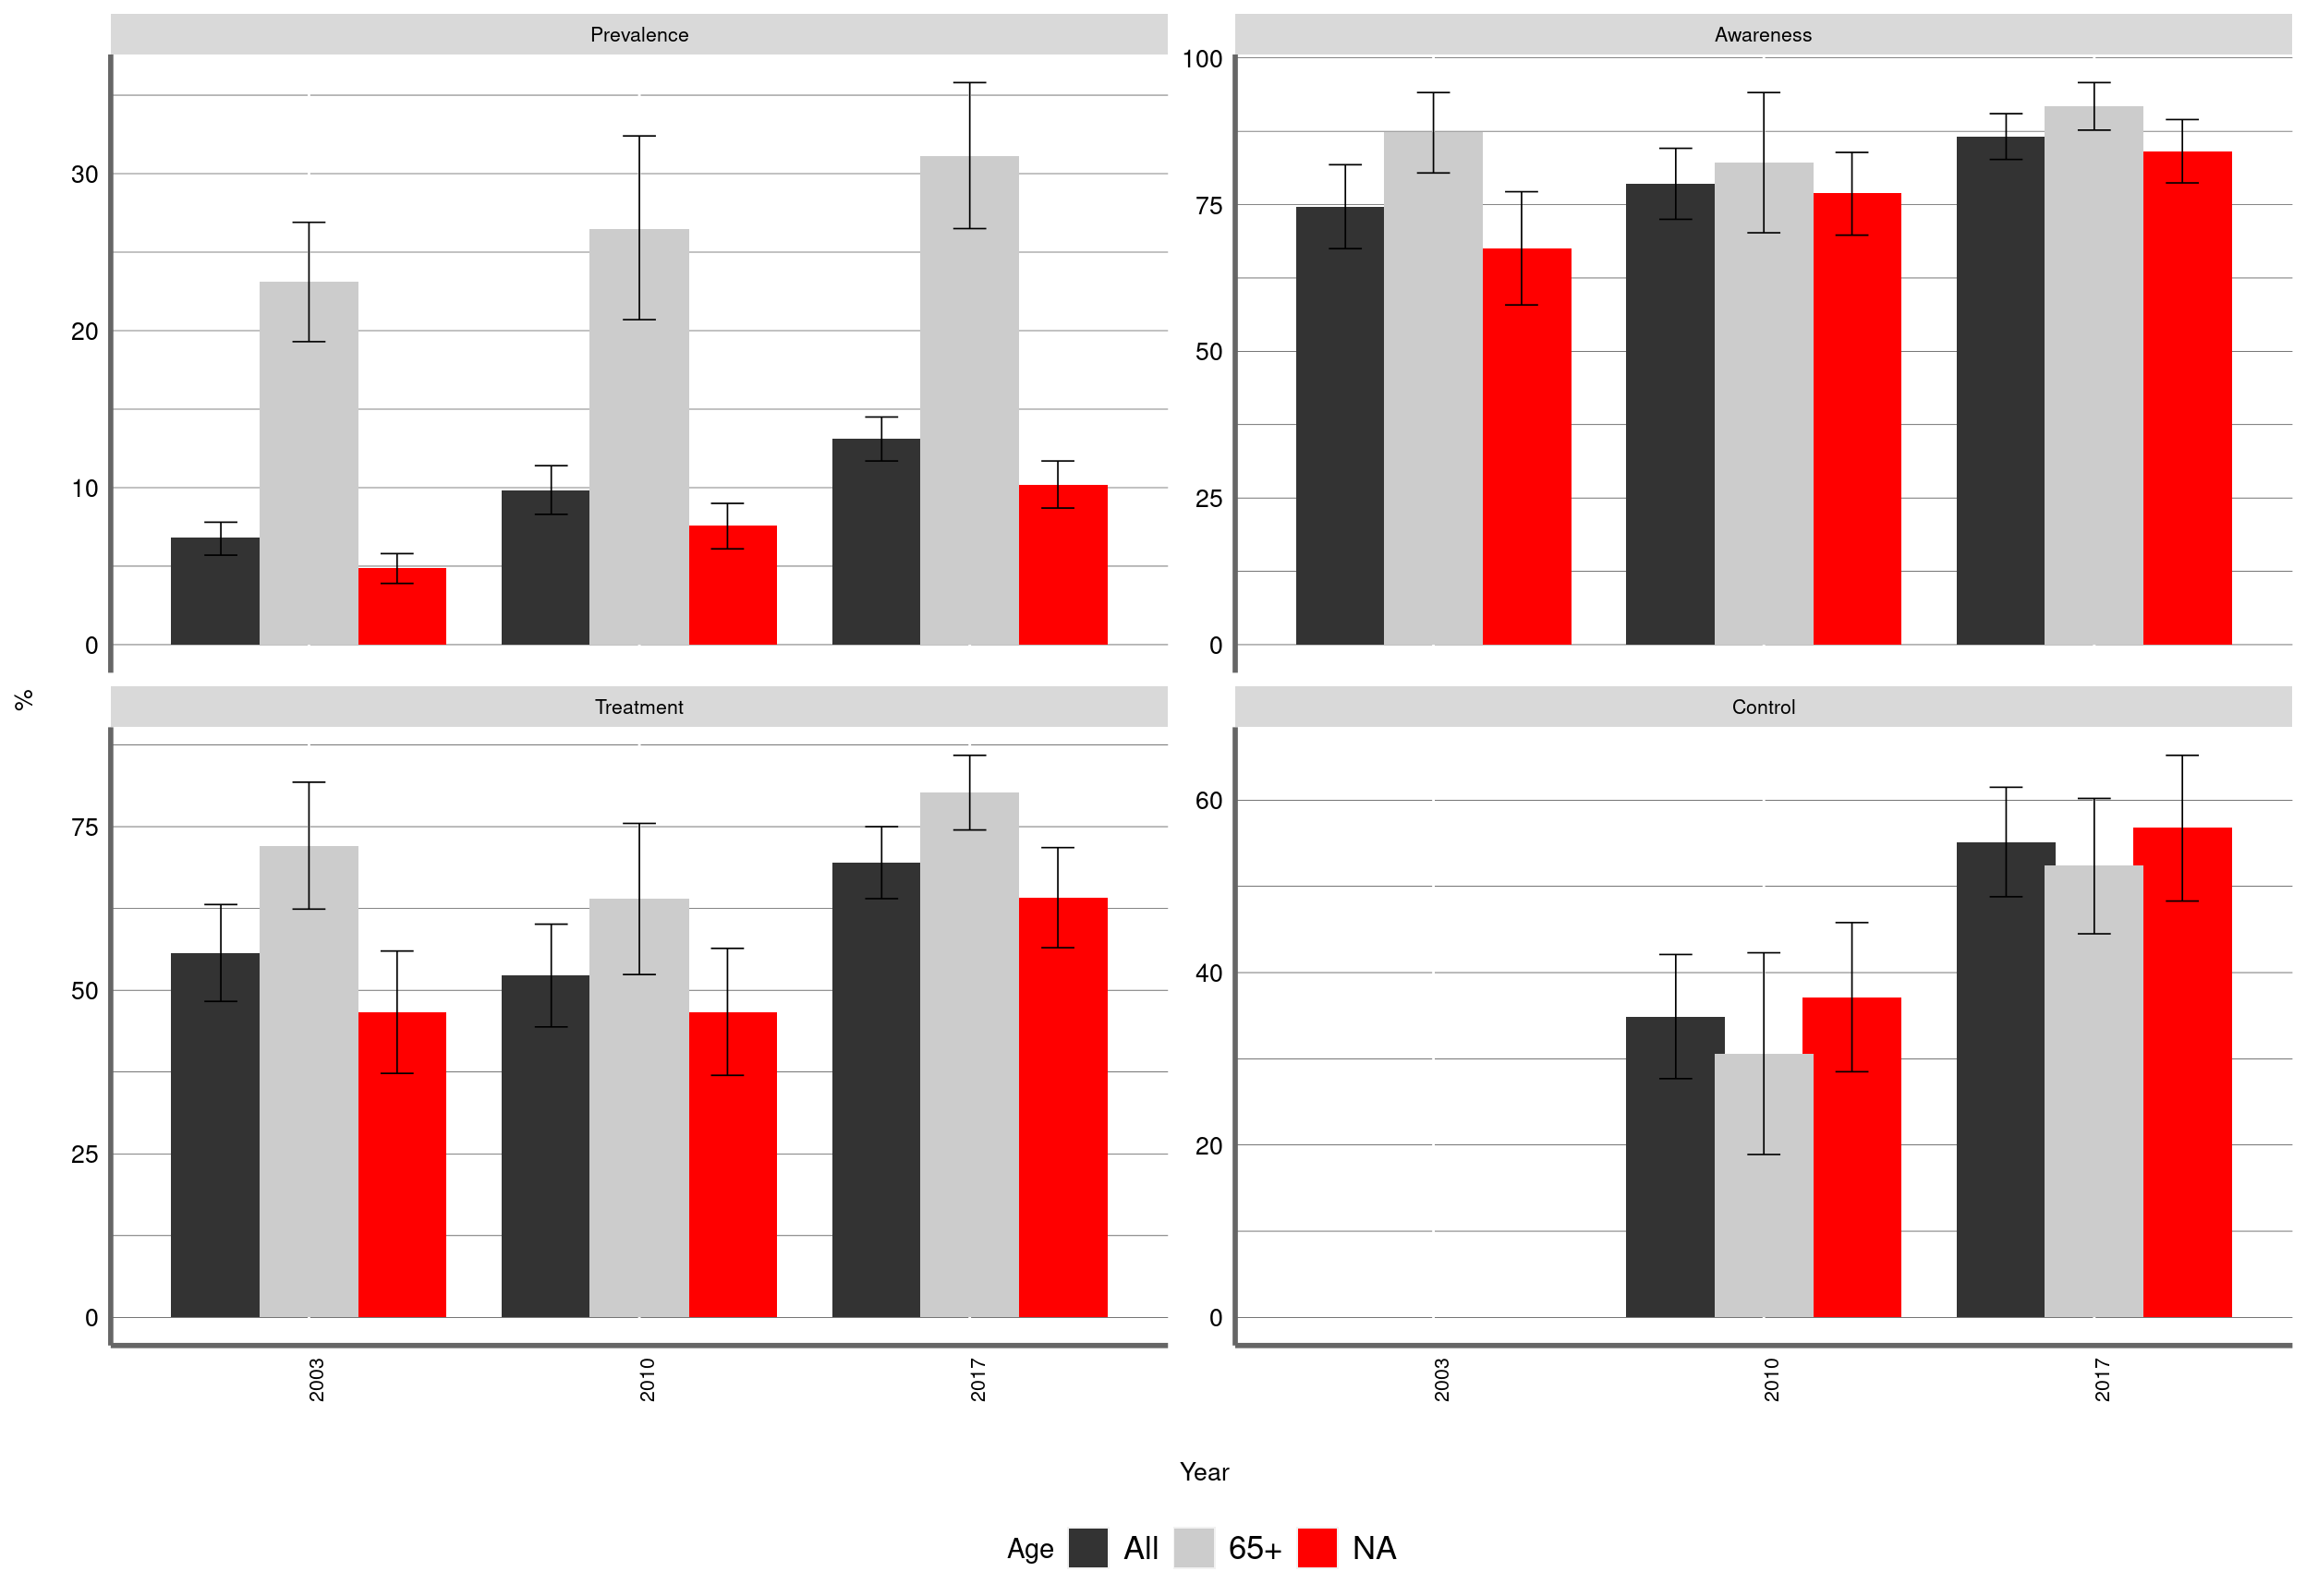
Figure 5: Prevalence and management of Diabetes by categorized BMI. Chile, ENS2003-2010-2017
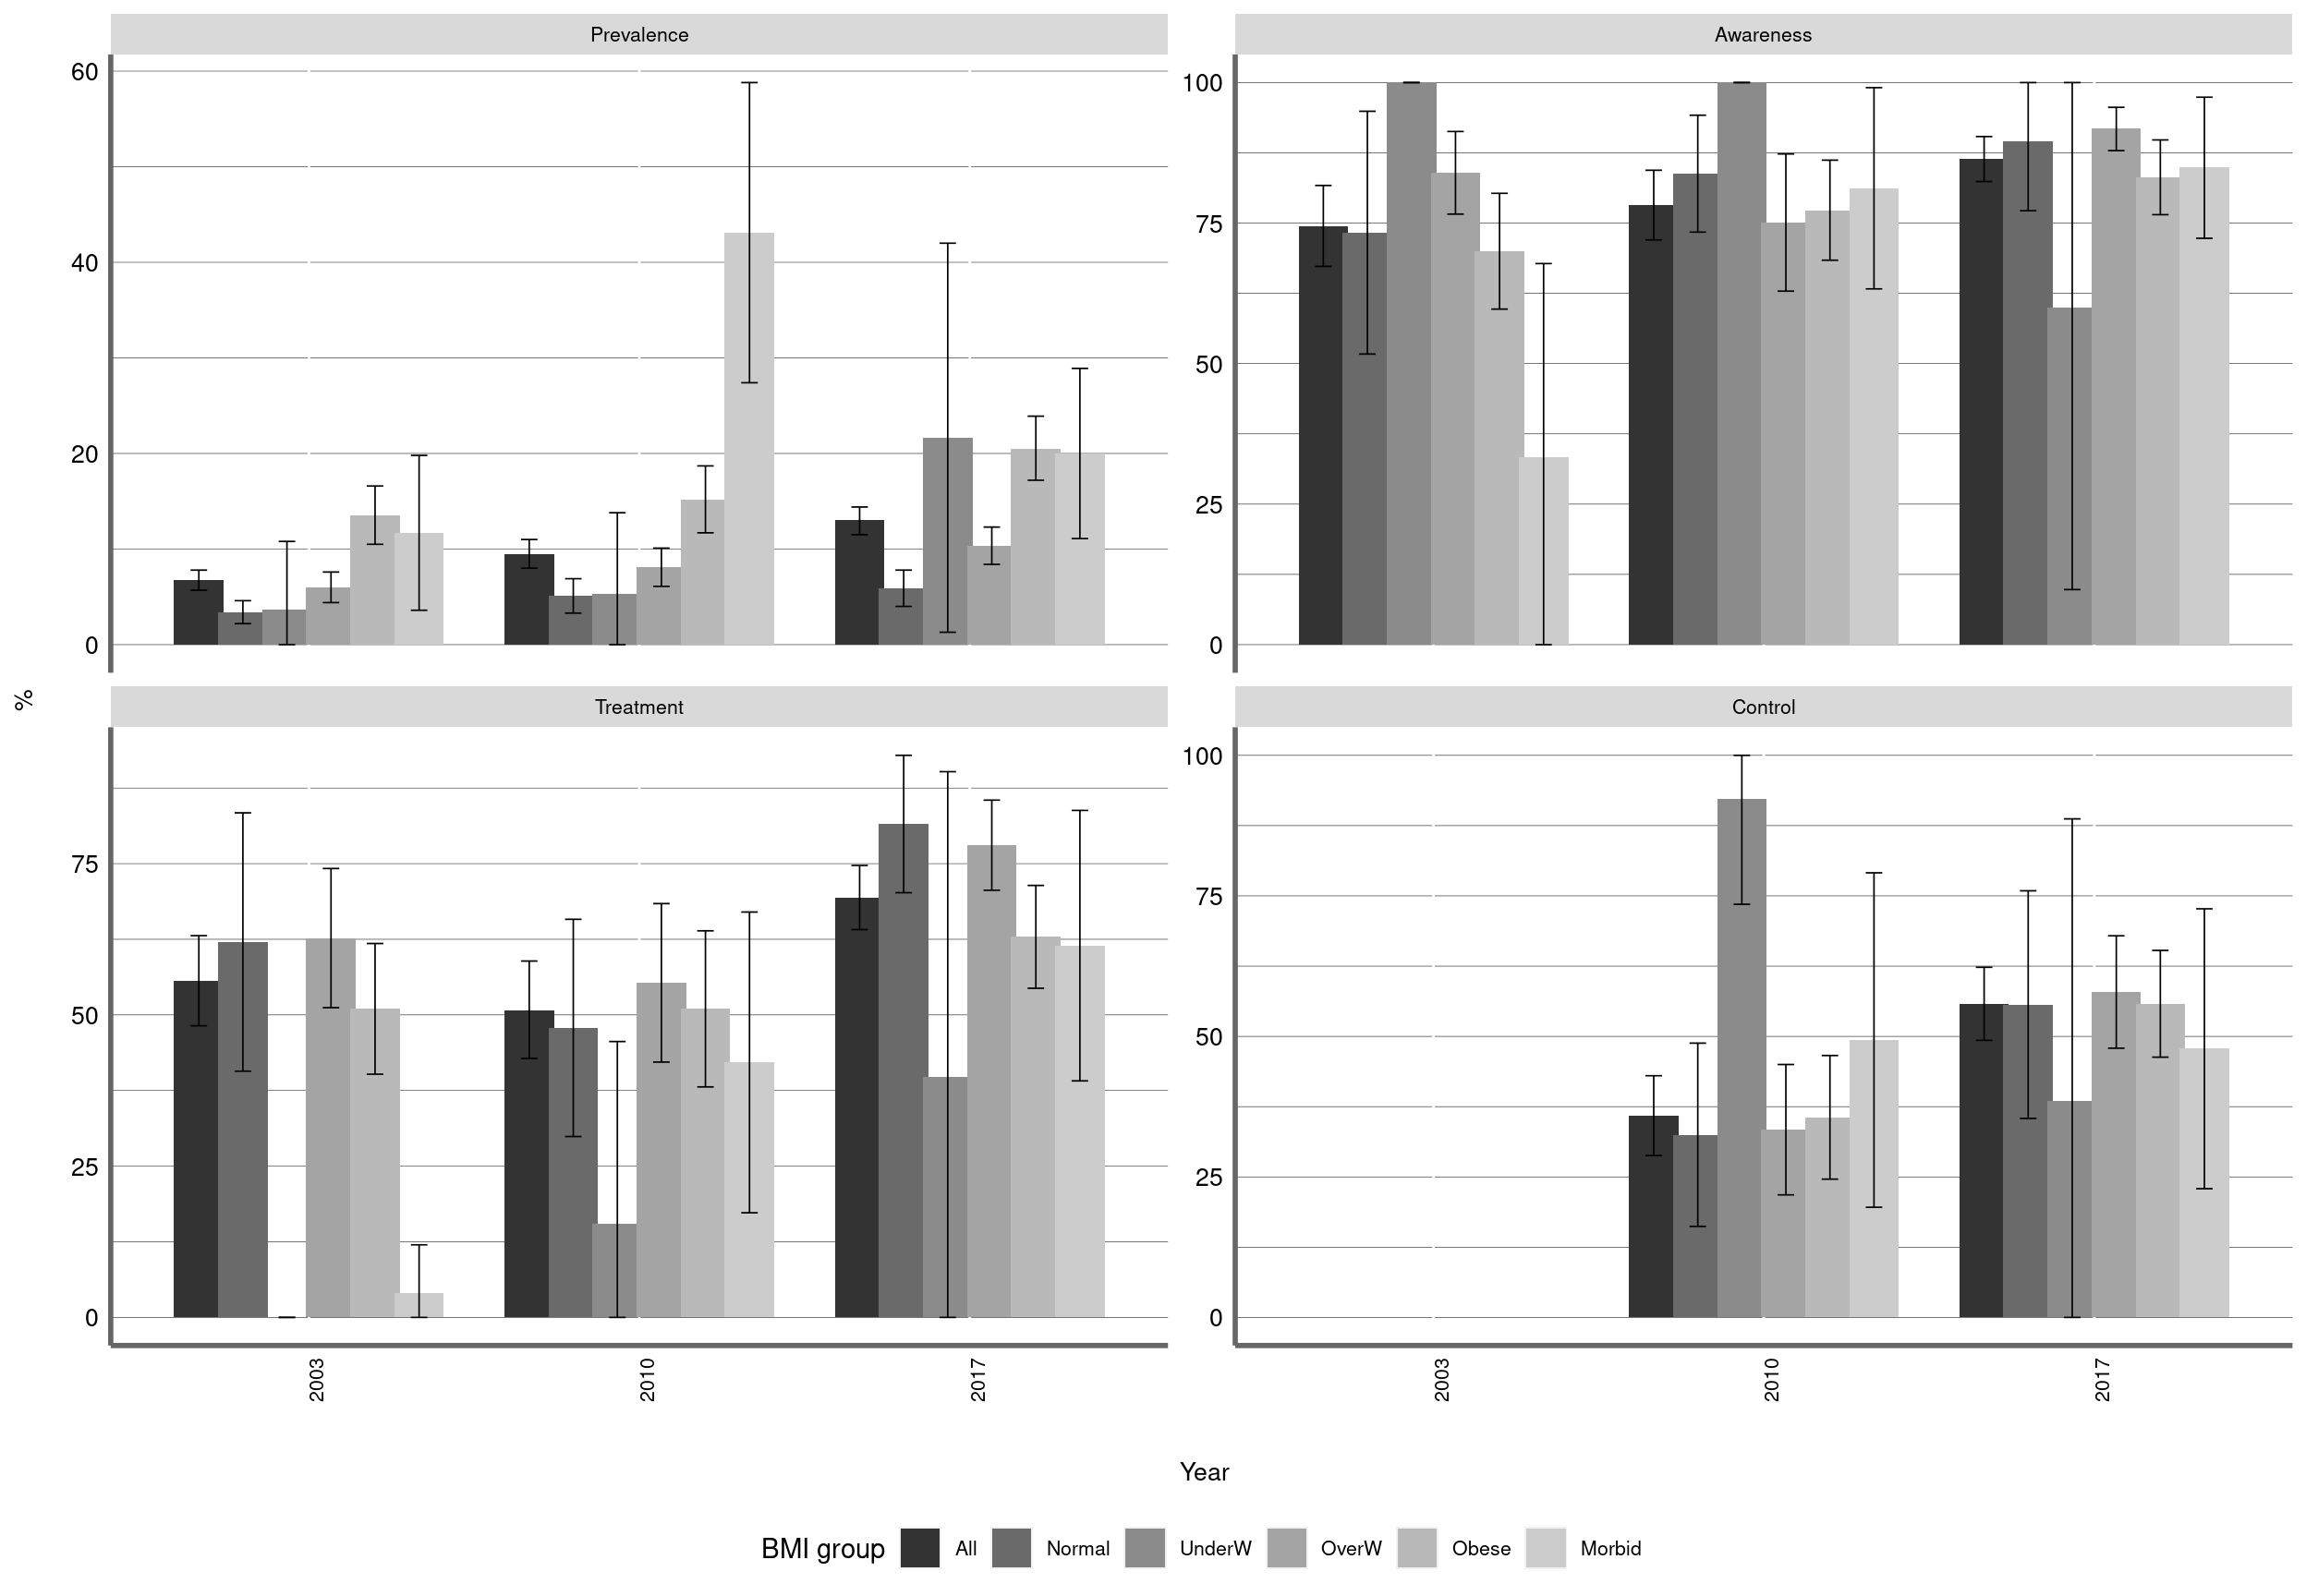
Figure 6: Prevalence and management of Diabetes by categorized multimorbidity index. Chile, ENS2003-2010-2017
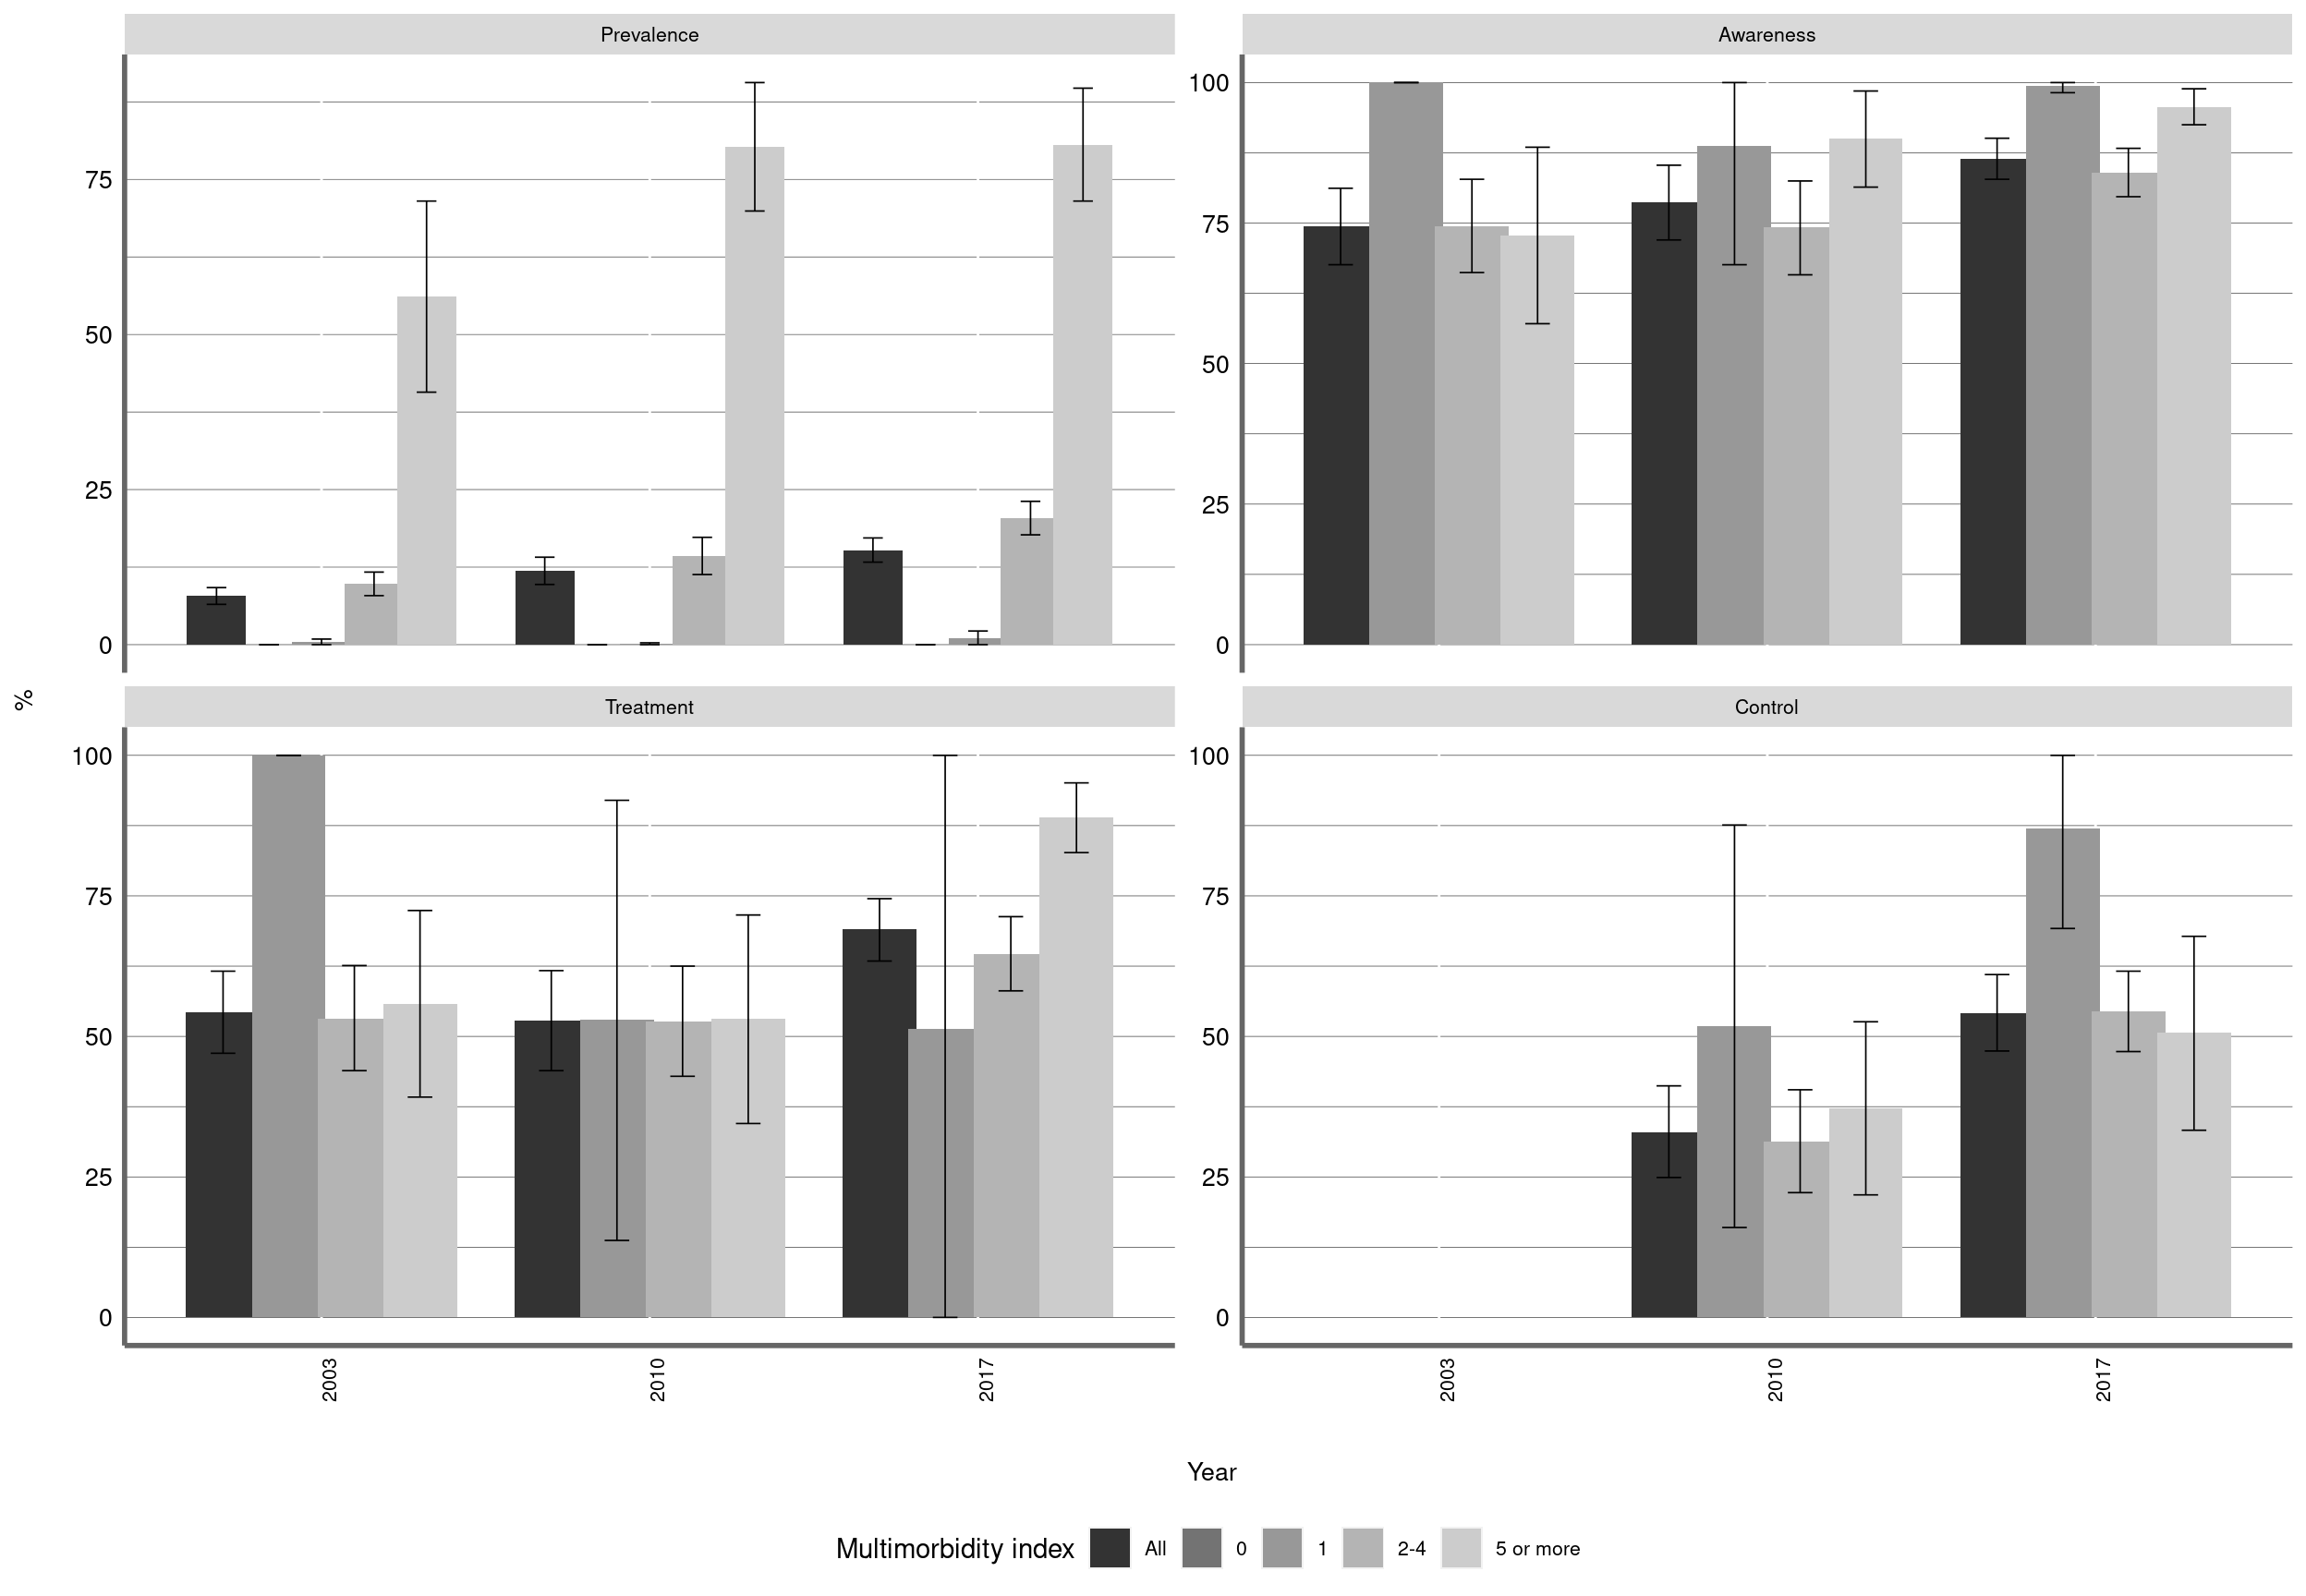
The index includes 7 conditions: diabetes, hypertension, dyslipidemia, musculoskeletal symptoms, kidney disease, depression and obesity.