2. Systematic review
SYSTEMATIC REVIEW OF SOCIOECONOMIC INEQUALITIES IN HYPERTENSION MANAGEMENT IN LATIN AMERICAN AND CARIBBEAN COUNTRIES
2. 1. INTRODUCTION
Hypertension is the most significant contributor to mortality worldwide,[1] and is well known to be socially graded in HICs: those with fewer resources are more likely than those with more resources to have CVD-related risk factors (e.g. hypertension), morbidity and mortality.[2–5] In contrast, evidence remains limited in LMICs,[4, 6, 7] and shows mixed results, showing higher hypertension prevalence among the most advantaged,[8] or non-significant SEP-hypertension associations.[9] A systematic review of global disparities in hypertension prevalence and management showed a higher prevalence of hypertension among LMICs compared to HICs.[10] Simultaneously, disparities in hypertension prevalence are magnified by disparities in levels of awareness, treatment and control (i.e. cascade of care indicators).[10] Amongst those classified as hypertensive, rates of under-diagnosis, non-treatment and poor control were found to be twice as high in LMICs.[11]
Although knowledge on the association between markers of SEP and hypertension prevalence in LACcs has accumulated in recent years, evidence of SEP variations in hypertension management (SEP-HM) is scarce worldwide and is exceptionally rare in LACcs. Recent systematic reviews on SEP-CVD associations have highlighted the lack of information in LACcs.[3, 4, 12] Some factors that are associated with variations across SEP in hypertension management differ from those related to variations across SEP in hypertension prevalence, and moreover, the factors associated with each could change over time within the same population.[13–16] Therefore, a systematic understanding of how SEP contributes to variations in hypertension management in LACcs is required to better address the burden in the region. Consequently, a systematic review of the SEP-HM association in LACcs was conducted.
The chapter continues with the aims and the methods of the review. I then describe the results, including the PRISMA flow diagram of articles retrieved by the search, discuss the range of methods researchers have used to assess SEP-HM and summarise the direction of the associations. The chapter ends with a discussion of the main findings and the implications for my subsequent chapter.
2. 2. AIM AND OBJECTIVES OF THE SYSTEMATIC REVIEW
This systematic review aims to describe the current evidence about SEP-HM associations in LACcs. The specific objectives are as follows:
- Describe the most common SEP associations with hypertension awareness in LACcs.
- Describe the most common SEP associations with hypertension treatment in LACcs.
- Describe the most common SEP associations with control of hypertension in LACcs.
- Evaluate the principal analytical techniques used to estimate these associations in LACcs, including the definitions of hypertension and its management and the chosen statistical measures of inequality.
- Where relevant, objectives 1 to 3 will also consider gender and country-specific SEP-HM associations.
2. 3. LITERATURE SEARCH METHODS
2.3. 1. Search Strategy
The systematic review presented herein was prepared according to the Preferred Reporting Items for Systematic Reviews and Meta-Analyses (PRISMA) guidelines [17].
I conducted a systematic literature search using two search engines: OvidSP and BVSalud, from mid-March 2018 to April 2018, without language limitations. This systematic review was updated in march 2021.
2.3. 2. Eligibility criteria
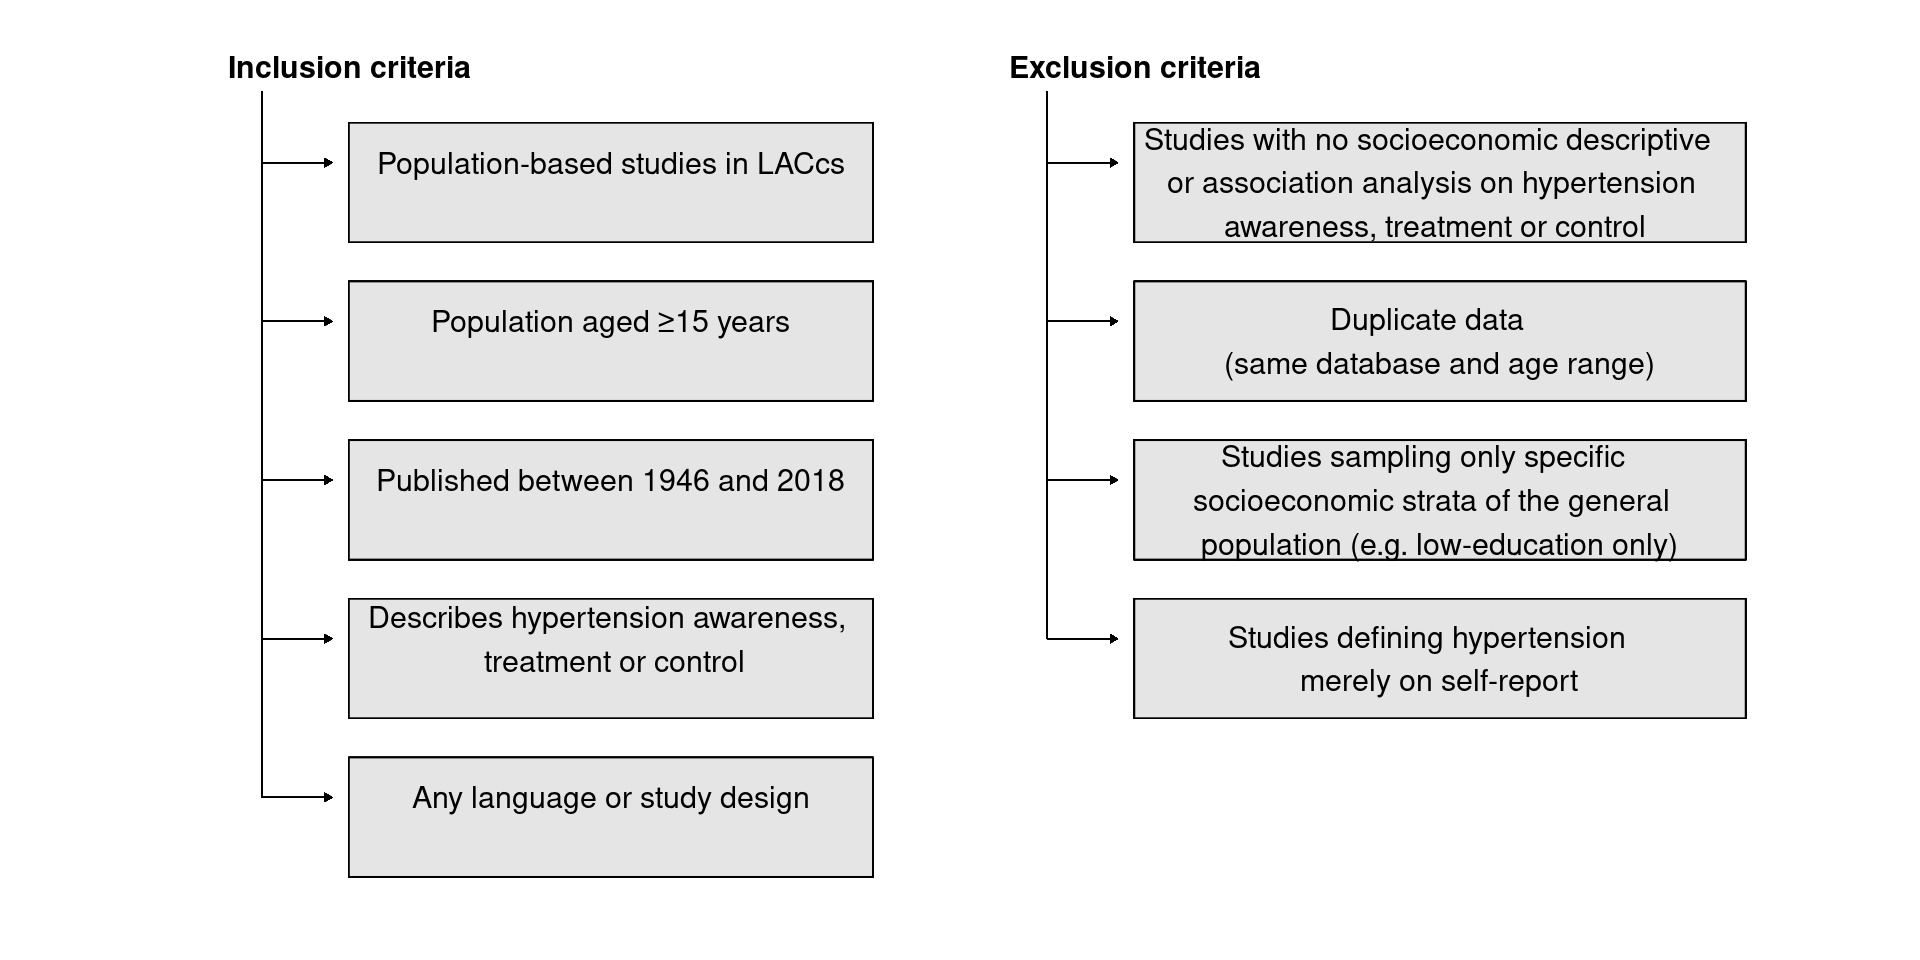
Eligibility criteria were designed to be more sensitive than specific (Figure 2. 1). In this way, an article evaluating an adult population-based setting describing at least one hypertension management indicator was included for full-text reading.
Figure 2. 1: Inclusion and exclusion criteria for the systematic review
2.3. 3. Information sources
I conducted a systematic literature search using two search engines: OvidSP and BVSalud, from mid-March 2018 to April 2018 (updated in march 2021). Several electronic databases were used, as described in Figure 2. 2.
Figure 2. 2: Search engines and databases used in the systematic review

Four concepts: (1) hypertension, (2) general population, (3) Socioeconomic and (4) Latin America and the Caribbean were constructed using thesaurus terms and textword searching, combined in a single syntax using Boolean operators (Figure 2. 3). This process was repeated for each OvidSP database and once for the four databases on BVSalud, as thesauri differ within OvidSP databases, while BVSalud uses a single thesaurus system.
Figure 2. 3: Creation process for search syntax

Hypertension management was not included as a fifth term as the search failed to retrieve several important articles that I had identified beforehand (see search syntax in Table A2.1 Appendix A2.
I searched for additional literature within the reference section of sources selected for full-text reading and within reports on LACcs’ National Health Surveys. A full-text version of all potentially relevant articles, theses, and dissertations was downloaded from electronic databases. If not found, the article was requested by e-mail from the authors.
2.3. 4. Definition of terms included in the search strategy
As mentioned above, my review focused on four concepts: (1) hypertension, (2) general population, (3) Socioeconomic and (4) Latin America and Caribbean. These are defined in turn below.
Concept 1: hypertension was defined as high BP or current use of antihypertensive medication. Studies were restricted to those using BP measurement to classify persons as hypertensive and so studies relying on self-report data were excluded.
Concept 2: general population was defined as the population excluding those who reside in an institution (hospital, criminal, mental, or other types of facilities). No other restrictions applied, except for the place of residence (being outside LACcs) and age (<15 years).
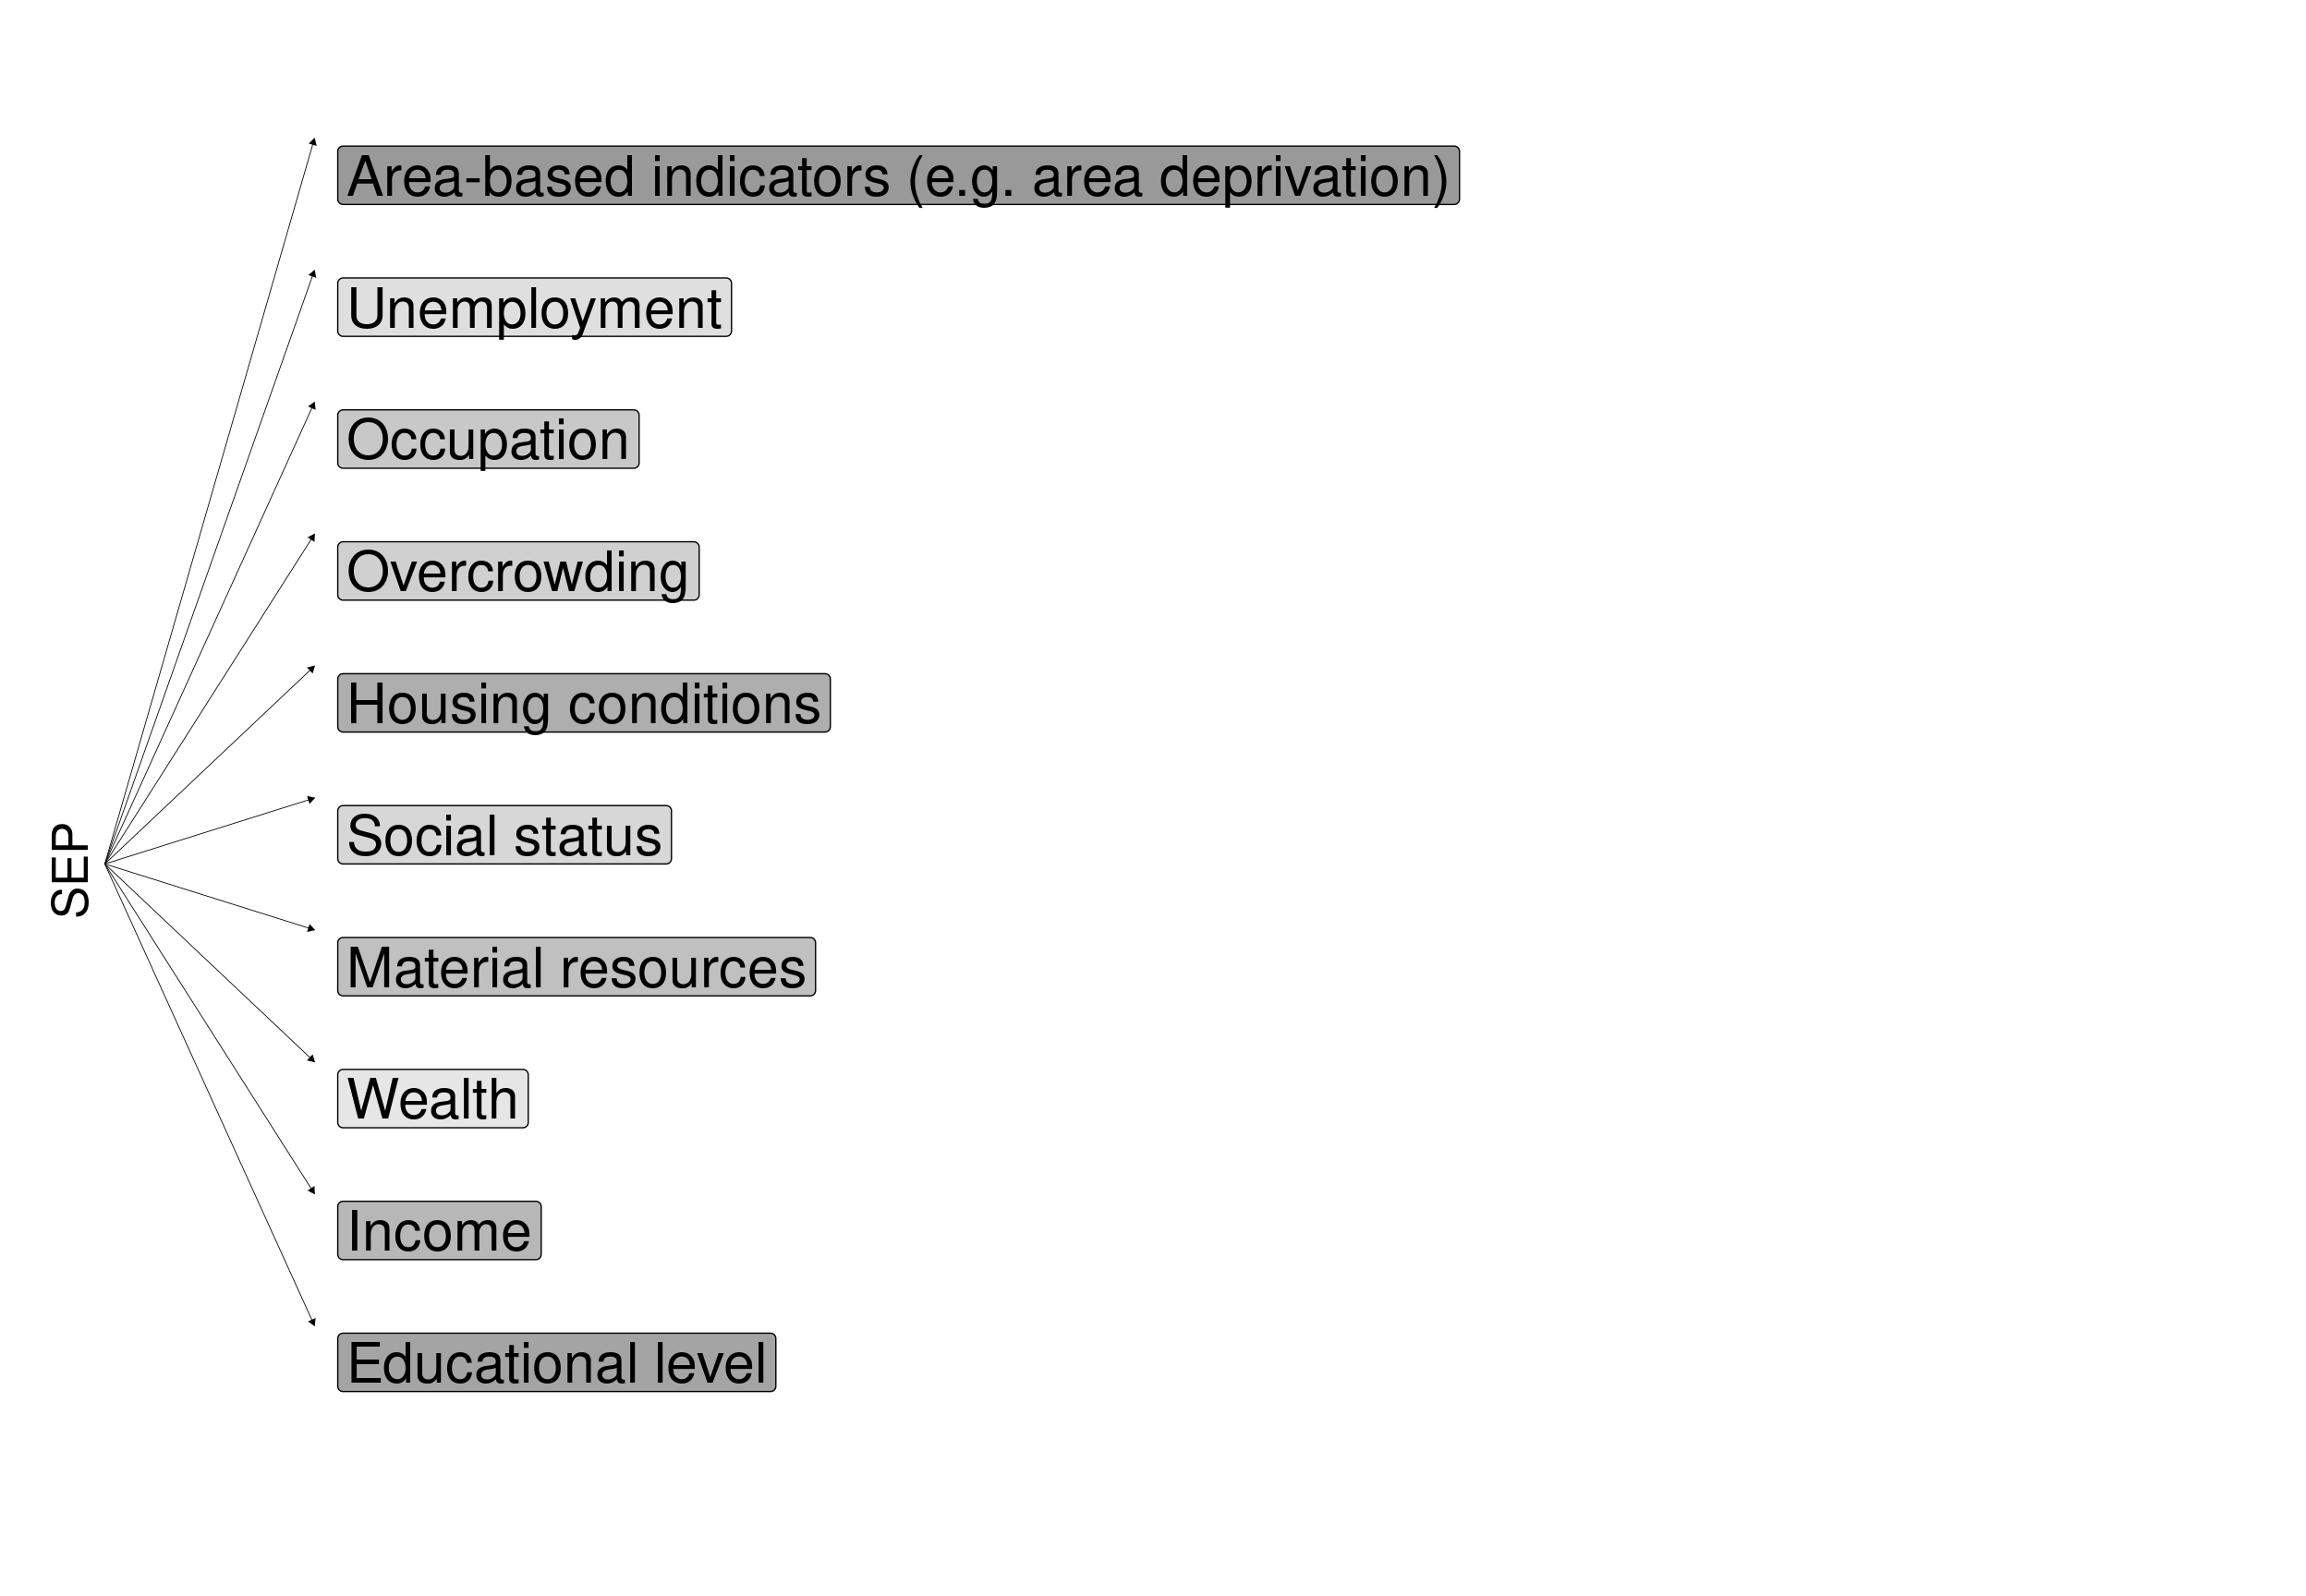
Concept 3: SEP refers to the social and economic factors that influence what positions individuals or groups hold within the structure of a society.[18] There is no single best indicator of SEP, as it depends on the outcome to be evaluated and on the population being researched. Each indicator focusses on a characteristic of social stratification; different measures may be more important to different health outcomes and at different stages in the life-course. All SEP indicators measure socioeconomic stratification, and in this way, they are interdependent to varying degrees. Area level markers of SEP were also included to capture factors that potentially influence levels of hypertension management that are not accounted for by individual-level SEP. Most of the research on SEP measures and health outcomes is based on data from HICs. Since social stratification processes are different for LMIC and HICs, the tools used to measure SEP are also different. Differences in SEP measurements and their interpretation among LMICs were evaluated by Howe et al. [19]. A brief description of the SEP classification; advantages and disadvantages; and differences between HICs and LMICs are included in Table 2. 1
Table 2. 1. SEP indicators: definition, characteristics, advantages and disadvantages
| Characteristic | Description |
|---|---|
| SEP | Area level SEP |
| Definition | Socioeconomic condition of an area |
| Characteristics | Could be defined at the neighbourhood, city or a larger geographic area |
| Associated with individual-level characteristics, such as unemployment, social class, education or housing tenure | |
| Advantages | Easy to measure |
| Known to be related with hypertensive prevalence and management | |
| Can help to understand better area level policies | |
| Disadvantages | Difficulties comparing between countries and cohorts within countries |
| Most of the times is used aggregating data, not available at the individual level. Highly correlated data increase error in the estimation- | |
| SEP | Asset-based |
| Definition | Wealth index composed of ownership of durable assets, housing characteristics and access to basic services |
| Characteristics | Measure the material aspects of living conditions |
| Could work as an alternative to consumption expenditure. | |
| Advantages | Rapid and easy to measure with questionaries |
| Could be more stable than more than consumption expenditure | |
| Disadvantages | Needs to define how to weight each item |
| Mostly used as a measure of relative rather than absolute SEP, which can only be used to assess SEP ranking within a population (e.g. I can not use the same value of the lower quintile to compare with another country) | |
| Modest inter-observer and test–retest reliability | |
| Difficulty in ascertaining asset quality | |
| HIC vs LMIC | LMICs show greater seasonality in consumption patterns than in HIC, giving more relevance to the asset-based measures |
| Asset indices need to be more detailed in determining the quality and nature of consumer durables in LMICs | |
| Risk of ‘urban bias’: capture SEP better in urban than rural areas | |
| If proportional weights are used, it is relevant to differently weight the assets for LMIC and HIC | |
| SEP | Consumption expenditure |
| Definition | Capture the extent to which a household can meet its material needs |
| Characteristics | Considered an alternative to income |
| Measured by summing expenditures on goods and services | |
| Advantages | More stable over time than income |
| Disadvantages | Long questionnarie, difficult to include in epidemiological studies. |
| Lower response rate than other SEP indicators | |
| HIC vs LMIC | Among LMIC is commonly measured using diary methods, while in LMICs this is difficult to do. It is better to use in LMICs a long list of potential expenditure items on the questionnaire (including home-produced goods and goods received in-kind) |
| SEP | Education |
| Definition | Knowledge related assets of a person |
| Characteristics | Reflect the SEP context of the family of origin |
| Defines the type of job in adulthood | |
| Describes health literacy | |
| Associated with lifestyle behaviours | |
| Associated with treatment adherence | |
| Facilitates access and use of social and psychological resources | |
| Ill health in childhood could limit educational attendance and/or attainment | |
| Advantages | Easy to measure through questionnaires |
| Higher response rate (compared to income) | |
| In some countries (including Chile) is highly correlated to income | |
| Relevant to people regardless of age or working circumstances | |
| Disadvantages | Difficulties comparing between countries and cohorts within countries |
| Recent changes during the last decades in educational access for women and some minority groups | |
| Older cohorts will be over-represented among those classified as less educated | |
| Number of years of education or levels of attainment may contain no information about the quality of the educational experience | |
| HIC vs LMIC | Much of the theoretical basis, measurement and interpretation is common to LMIC and HIC |
| cohort effects and gender differences are likely to be of particular importance in LMIC | |
| Need to take into account if the years of completed education includes repeating school year, which is more common in LMIC | |
| If education is not universal freely available (as in many LMIC but also in Chile), education will reflect childhood family SEP more so in LMIC than in HIC | |
| SEP | Housing conditions, tenure and amenities |
| Definition | Measure material aspects of socioeconomic circumstances |
| Characteristics | Reflects social position though materiality, housing status, housing tenure, etc. |
| Describe daily-life conditions (crowding, amenities, exposure to pollutants, etc.) | |
| Advantages | Some characteristics can be described by the interviewer from the exterior (i.e. high response rate) |
| Disadvantages | Difficulties comparing between countries and cohorts within countries |
| SEP | Income |
| Definition | Material resources of an individual or household. |
| Characteristics | Reflects a lifetime effect |
| Can change over time | |
| Associated with access to risk and protective goods and services (e.g. type of diet, alcohol, exercise, healthcare, medicine use) | |
| Facilitates access and use of social and psychological resources | |
| Fostering self-esteem and social standing | |
| Advantages | Combines in a single indicator the material resources |
| Disadvantages | Lower response rate than education, especially among people with low SEP |
| Less reliable indicator of their true SEP among young and older because income typically follows a curvilinear trajectory with age | |
| HIC vs LMIC | Much of the theoretical basis, measurement and interpretation is common to LMIC and HIC |
| The greater extent of the informal economy, self-employment and seasonal activity in LMICs will impact the measurement of income | |
| The association between income and health is even more important if the country lacks social security systems. | |
| SEP | Occupation |
| Definition | Place in society, income and intellect and describes working relations between employers and employees |
| Characteristics | Widely used |
| Related to income and access to health resources | |
| Facilitates access and use of social and psychological resources | |
| Related to psychosocial factors such as support networks, stress in the workplace, control and autonomy | |
| Define exposure to risks such as accidents or toxic environments. | |
| Advantages | Measure through questionnaires and classified using international standards (e.g. ISO-88) |
| Simple to collect | |
| Disadvantages | Difficult to classify people not working |
| Difficult to compare between when different classifications are used | |
| HIC vs LMIC | More informal employment among LMIC, casual labour and small home enterprises will have an impact on its measurement, associate prestige and income. |
| Jobs involving exposure to hazardous substances or hard labour may be more common among LMICs | |
| Greater complexity of occupational life difficult their measurement in LMICs | |
| Lack of social support and employment rights increase the risk of unemployment when the individual gets sick. in some LMIC | |
| Child employment may be relevant in some LMICs. |
Figure 2. 4: SEP indicators included in the search syntax
Concept 4: LACcs consists of 19 sovereign states and several territories covering an area from the northern Mexican border to the southern tip of South America, including the Caribbean.
2.3. 5. Articles and reports selection and data collection
I screened relevant articles by first selecting by title and then by the abstract. Some articles were excluded during this stage as they failed to meet any inclusion criteria. The remainder were assessed for full-text reading, and those meeting the inclusion criteria were included for data extraction.
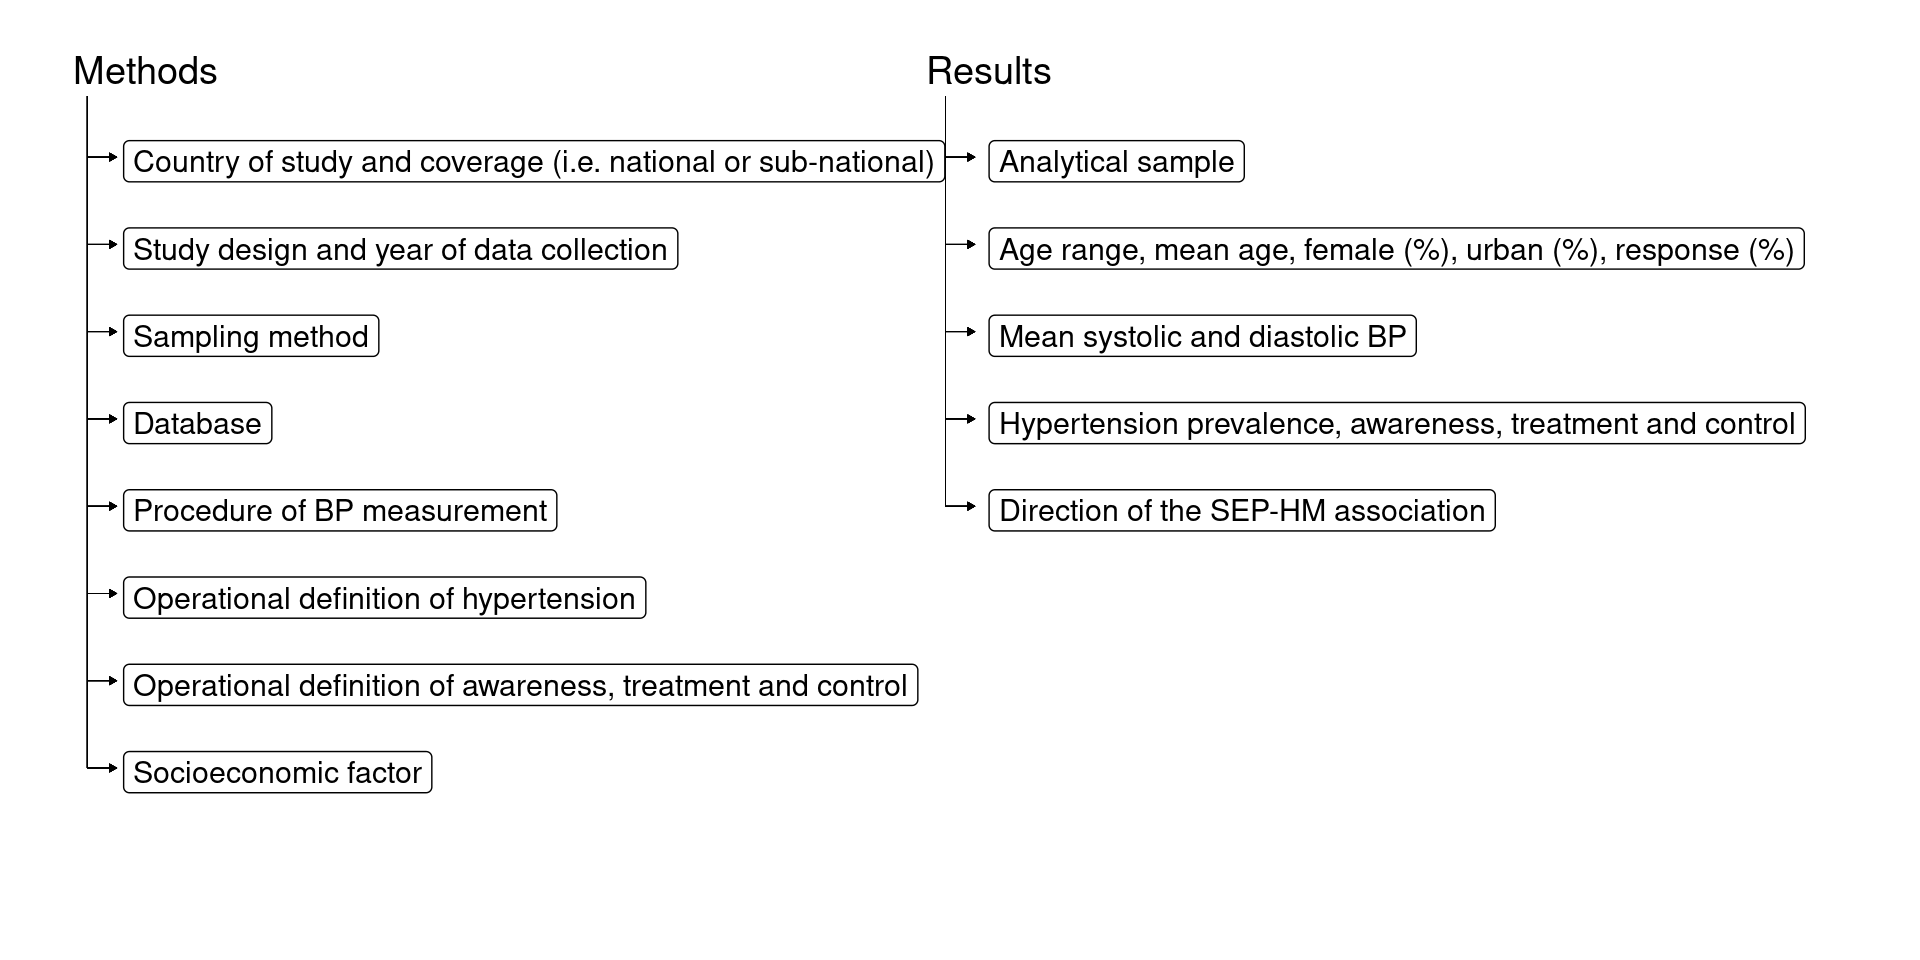
Data were entered in a Microsoft Office ExcelTM spreadsheet form organised by methods and results (Figure 2. 5). The direction of SEP-HM associations and the statistical methods used to summarise inequalities in hypertension management (e.g. whether age-adjustment was performed; and whether effect measures were absolute or relative) were the principal summary measures used in this review.
Figure 2. 5: Data extracted from the selected articles
2.3. 6. Classification of the outcome measures
The key indicators of hypertension management covered in the review apply to the hypertensive population (those classified as hypertensive being the denominator in the calculation of prevalence). However, studies defined hypertension differently. Table 2. 2 describes the five main definitions of hypertension I found in the literature and used in this review (as a consequence of my inclusion criteria, these all include objective measurements of BP). The prevalence of hypertension for each definition was calculated using the general population as the denominator.
Table 2. 2: Hypertension definitions
| Definition Number | Description |
|---|---|
| Definition 1 | BP≥140/90mmHg or using antihypertensive medication |
| Definition 2 | BP≥140/90mmHg or reported a diagnosis of hypertension made by a healthcare professional |
| Definition 3 | BP≥140/90mmHg or using antihypertensive medication or reported diagnosis of hypertension made by a healthcare professional |
| Definition 4 | BP≥140/90mmHg |
| Definition 5 | BP≥160/95mmHg* or using antihypertensive medication |
*Defined as an “old threshold” for high BP.[20]
There is no standard definition of awareness, treatment or control, as different denominators could be used for calculating prevalence (Figure 2. 6). For example, levels of controlled hypertension could be calculated using as denominator: all hypertensives; only those classified as hypertensive by a healthcare professional; or only those classified as using antihypertensive medication. SEP-HM associations (e.g. direction or level of statistical significance in a particular study) may vary according to the choice of denominator.
Figure 2. 6: Hypertension management denominators

2.3. 7. Classification of SEP
Only two out of the 10 SEP indicators listed in Figure 2. 4 were found in the review:
• Educational level: highest attained level (e.g. primary school, university) or total years of completed education.
• Financial resources: net or gross, individual or household, income or wealth.
2.3. 8. Classification of measures of health inequality
Measures of health inequality have been classified by the WHO as simple or complex[21]: simple measures make pairwise comparisons between SEP groups (e.g. using the odds ratio [OR] to compare the odds of an outcome for persons in the least and the most educated groups); complex measures (e.g. Relative Index of inequality [RII], Slope Index of inequality [SII], and concentration index) use data from all SEP groups to assess inequality using a single number that expresses the amount of inequality existing among all the SEP groups. Within each type of measure (simple or complex), inequalities can be quantified on an absolute or relative scale (Figure 2. 7). Absolute inequalities reflect the magnitude of difference in hypertension management levels (for example between two subgroups); relative inequalities quantify the proportional differences in health among subgroups.
Figure 2. 7: WHO classification of measures of health inequality and examples
| Type of measure | Simple measure of inequality | Complex measure of inequality |
|---|---|---|
| Absolute | Proportion difference Population Attributable Risk (PAR) (absolute) | Slope Index of inequality (SII) Absolute concentration index |
| Relative | Odds Ratio (OR), Risk Ratio (RR), Prevalence Ratio (PR) Population Attributable Risk (PAR) (%) | Relative Index of inequality (RII) Relative concentration index |
Source: WHO (2013)[21]
2.3. 9. Classification of the associations
In this review I use the terms ‘pro-poor,’ ‘non-significant’ and ‘pro-rich’ to summarise the direction of the SEP-HM associations, as described in Figure 2. 8
Figure 2. 8: Direction of SEP-HM associations
| Direction of association | Definition |
|---|---|
| Pro-poor | Inverse, significant SEP-HM association (e.g. lower financial resources associated with higher levels of awareness). |
| Non-significant | Non-significant SEP-HM association. |
| Pro-rich | Positive, significant SEP-HM association (e.g. higher financial resources associated with higher levels of awareness). |
I classified the statistical significance of SEP-HM associations using P-values <0.05 for two-tailed tests. In those cases when the marker for the SEP had more than two categories, I used the overall test of significance or the test for trend (when available). The overall test of significance implied that SEP was used as a categorical variable, comparing SEP groups to a reference (e.g. university degree versus <8 years of completed education). The test for trend implied a linear association, using SEP as a single continuous variable. When no test was reported, I evaluated the association by examining the significance level of the difference between the highest and lowest SEP groups. Detailed information about how I classified associations in descriptive studies is provided in Appendix A2 - section “Special cases for classifying outcomes and associations”. I classified SEP-HM associations as non-significant if the results suggested a curvilinear trend (e.g. when only the middle SEP was significantly different from the reference category but not the extremes). If an article presented both unadjusted and adjusted results, I classified the association based on the adjusted results (e.g. age is a strong potential confounder of SEP-HM associations). The distribution of pro-poor, non-significant and pro-rich associations was evaluated by SEP indicator, gender and country.
2.3. 10. Quality sensitivity analysis
I conducted a sensitivity analysis (Table 2. 9: ) in order to examine the strength of the SEP-HM associations amongst those associations grouped by inequality measure (simple versus complex), age-adjustment (yes versus no), documentation of response levels to the survey (yes versus no) and reporting of sample size
To test for significant statistical differences in the distribution of pro-poor, non-significant, and pro-rich associations, I performed a Chi-square test (χ2) and reported the p-value. Analyses were conducted in Stata V14.0 (StataCorp LP, College Station, Texas, US).
2. 4. RESULTS
2.4. 1. Study selection
The search strategy retrieved 3,834 unique and potentially relevant titles. After scanning titles and abstracts, I identified a total of 194 articles (5%) for inclusion, of which I then excluded 180. Figure 2. 9 shows the detailed exclusion criteria used. After scanning the references of the articles retrieved, a further five articles were included. One document, my master thesis,[22] was included from the grey literature: it describes biological, demographic and SEP associations with levels of BP control using data from the ENS2010. To date, I have included a total of 20 articles for data extraction.
Figure 2. 9: PRISMA flow diagram of the number of articles retrieved by the systematic search
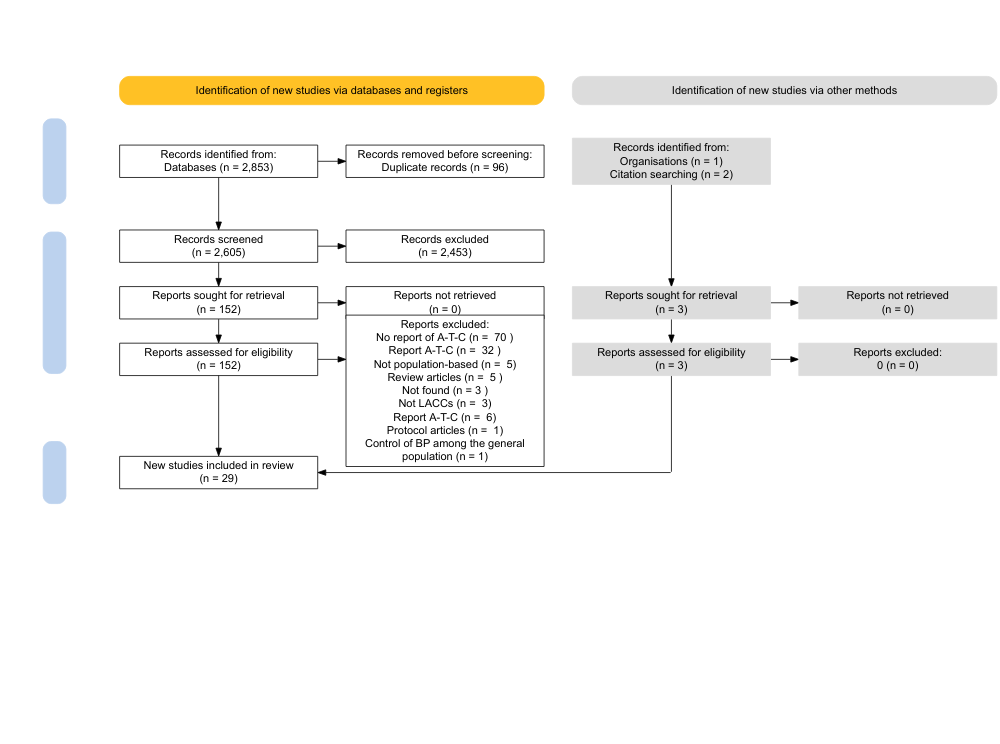
HM: Hypertension management; HTN: Hypertension; SEP: Socioeconomic position; LACcs: Latin America and Caribbean countries.
2.4. 2. Choice of the denominator
In the following sections, I use different denominators to summarise the results of the review (Figure 2. 10):
Figure 2. 10: Schematic representation of the denominators

The total number of articles included in this review was 20 (denominator 1). Three of these articles outlined SEP-HM associations in more than one population (e.g. from different countries or different years). Because of this, the denominator increased from a set of 20 articles to 28 populations (denominator 2). Specifically, Irazola [23] described results in four LACcs (Argentina, Chile, Peru and Uruguay) and Palafox[24] from four LACcs (Argentina, Brazil, Chile and Colombia). Gutierrez[25] described results in Mexico across three survey years (2000, 2006 and 2012).
These 28 populations contained a total of 103 unique SEP-HM associations (denominator 3). Table A2.2 Appendix A2 shows the list of SEP-HM associations reported for each population by outcome, country, year of data collection, measure of SEP and statistical method(s).
2.4. 3. Study characteristics
Table 2. 3 describes the study author, country of study, geographical coverage, study design, year of data collection, age-range, response rate, sample size, and definition of hypertension for each of the 28 populations covered by the 20 included articles.
Table 2. 3: General information and methods of the articles included in the systematic review
Add numbers to csv in final version Palafox [24] Irazola [23] Gus [26] Moreira [27] Chrestani [29] Zattar [30] Margozzini [31] Passi [22] Ordunez [32] Gutierrez [25] Barquera [34] Lloyd-Sherlock [35] Basu [36] Nonato [37] CamposNonato127 [38] Laux [40] Lerner [41] Zavala [42] Gulliford [20] Rubinstein [43]
•Sample size for calculating hypertension prevalence; BP: Blood pressure; N/A: Not available; Coverage (N: National, SN: Subnational); Study design (C: Cross-sectional, L: Longitudinal); ‡Cross-sectional analysis of cohort baseline data; * 1 BP measurement; * * 2 BP measurements; * * * 3 BP measurements.
Based on the inclusion criteria research on socioeconomic inequalities in hypertension management was available for 10 LACcs (Figure 2. 12). Most of the research was conducted in Mexico (8/28 populations), Brazil (5/28) and Chile (4/28).
Figure 2. 12: Populations included in the systematic review

The oldest study included in the review was conducted in 1999,[26] and the most recent was conducted in 2016.[38] Roughly two-thirds of the data (68%, 19/28) were collected before 2010.
A cross-sectional study design was used by 17/20 articles; 3/20 were prospective cohort studies: Pelotas (Brazilian cohort),[29] PURE (Chilean, Argentinian and Brazilian cohort),[24] and CRONICAS (Peruvian cohort).[42] These cohorts are described in Table A2.3 Appendix A2. Eight articles were based on data from nationally-representative samples, the remaining samples were representative of the general population at a subnational level. A variety of subnational samples were described, for example, Laux[40] sampled people aged 20–60 years from five communities in the northwest and one community in central Nicaragua, aimed to represent economic diversity. Palafox[24] sampled people aged 35-70 from communities in both rural and urban areas (the PURE study), to capture economic and sociocultural diversity and also includes sites where investigators were able to follow up participants over a number of years.
The lowest age included in the articles was 15 years, most focused on populations aged ≥20 years. Twenty-two of the 28 populations did not include an upper age limit; the remainder used an upper age limit between 60-89 years. 15/28 reported the proportion of the sample from rural areas (this ranged from 48% to 100%). The response rate was not described in 12/28 populations. Of those reporting the response rate, most were above 70% (range 52%-92%).
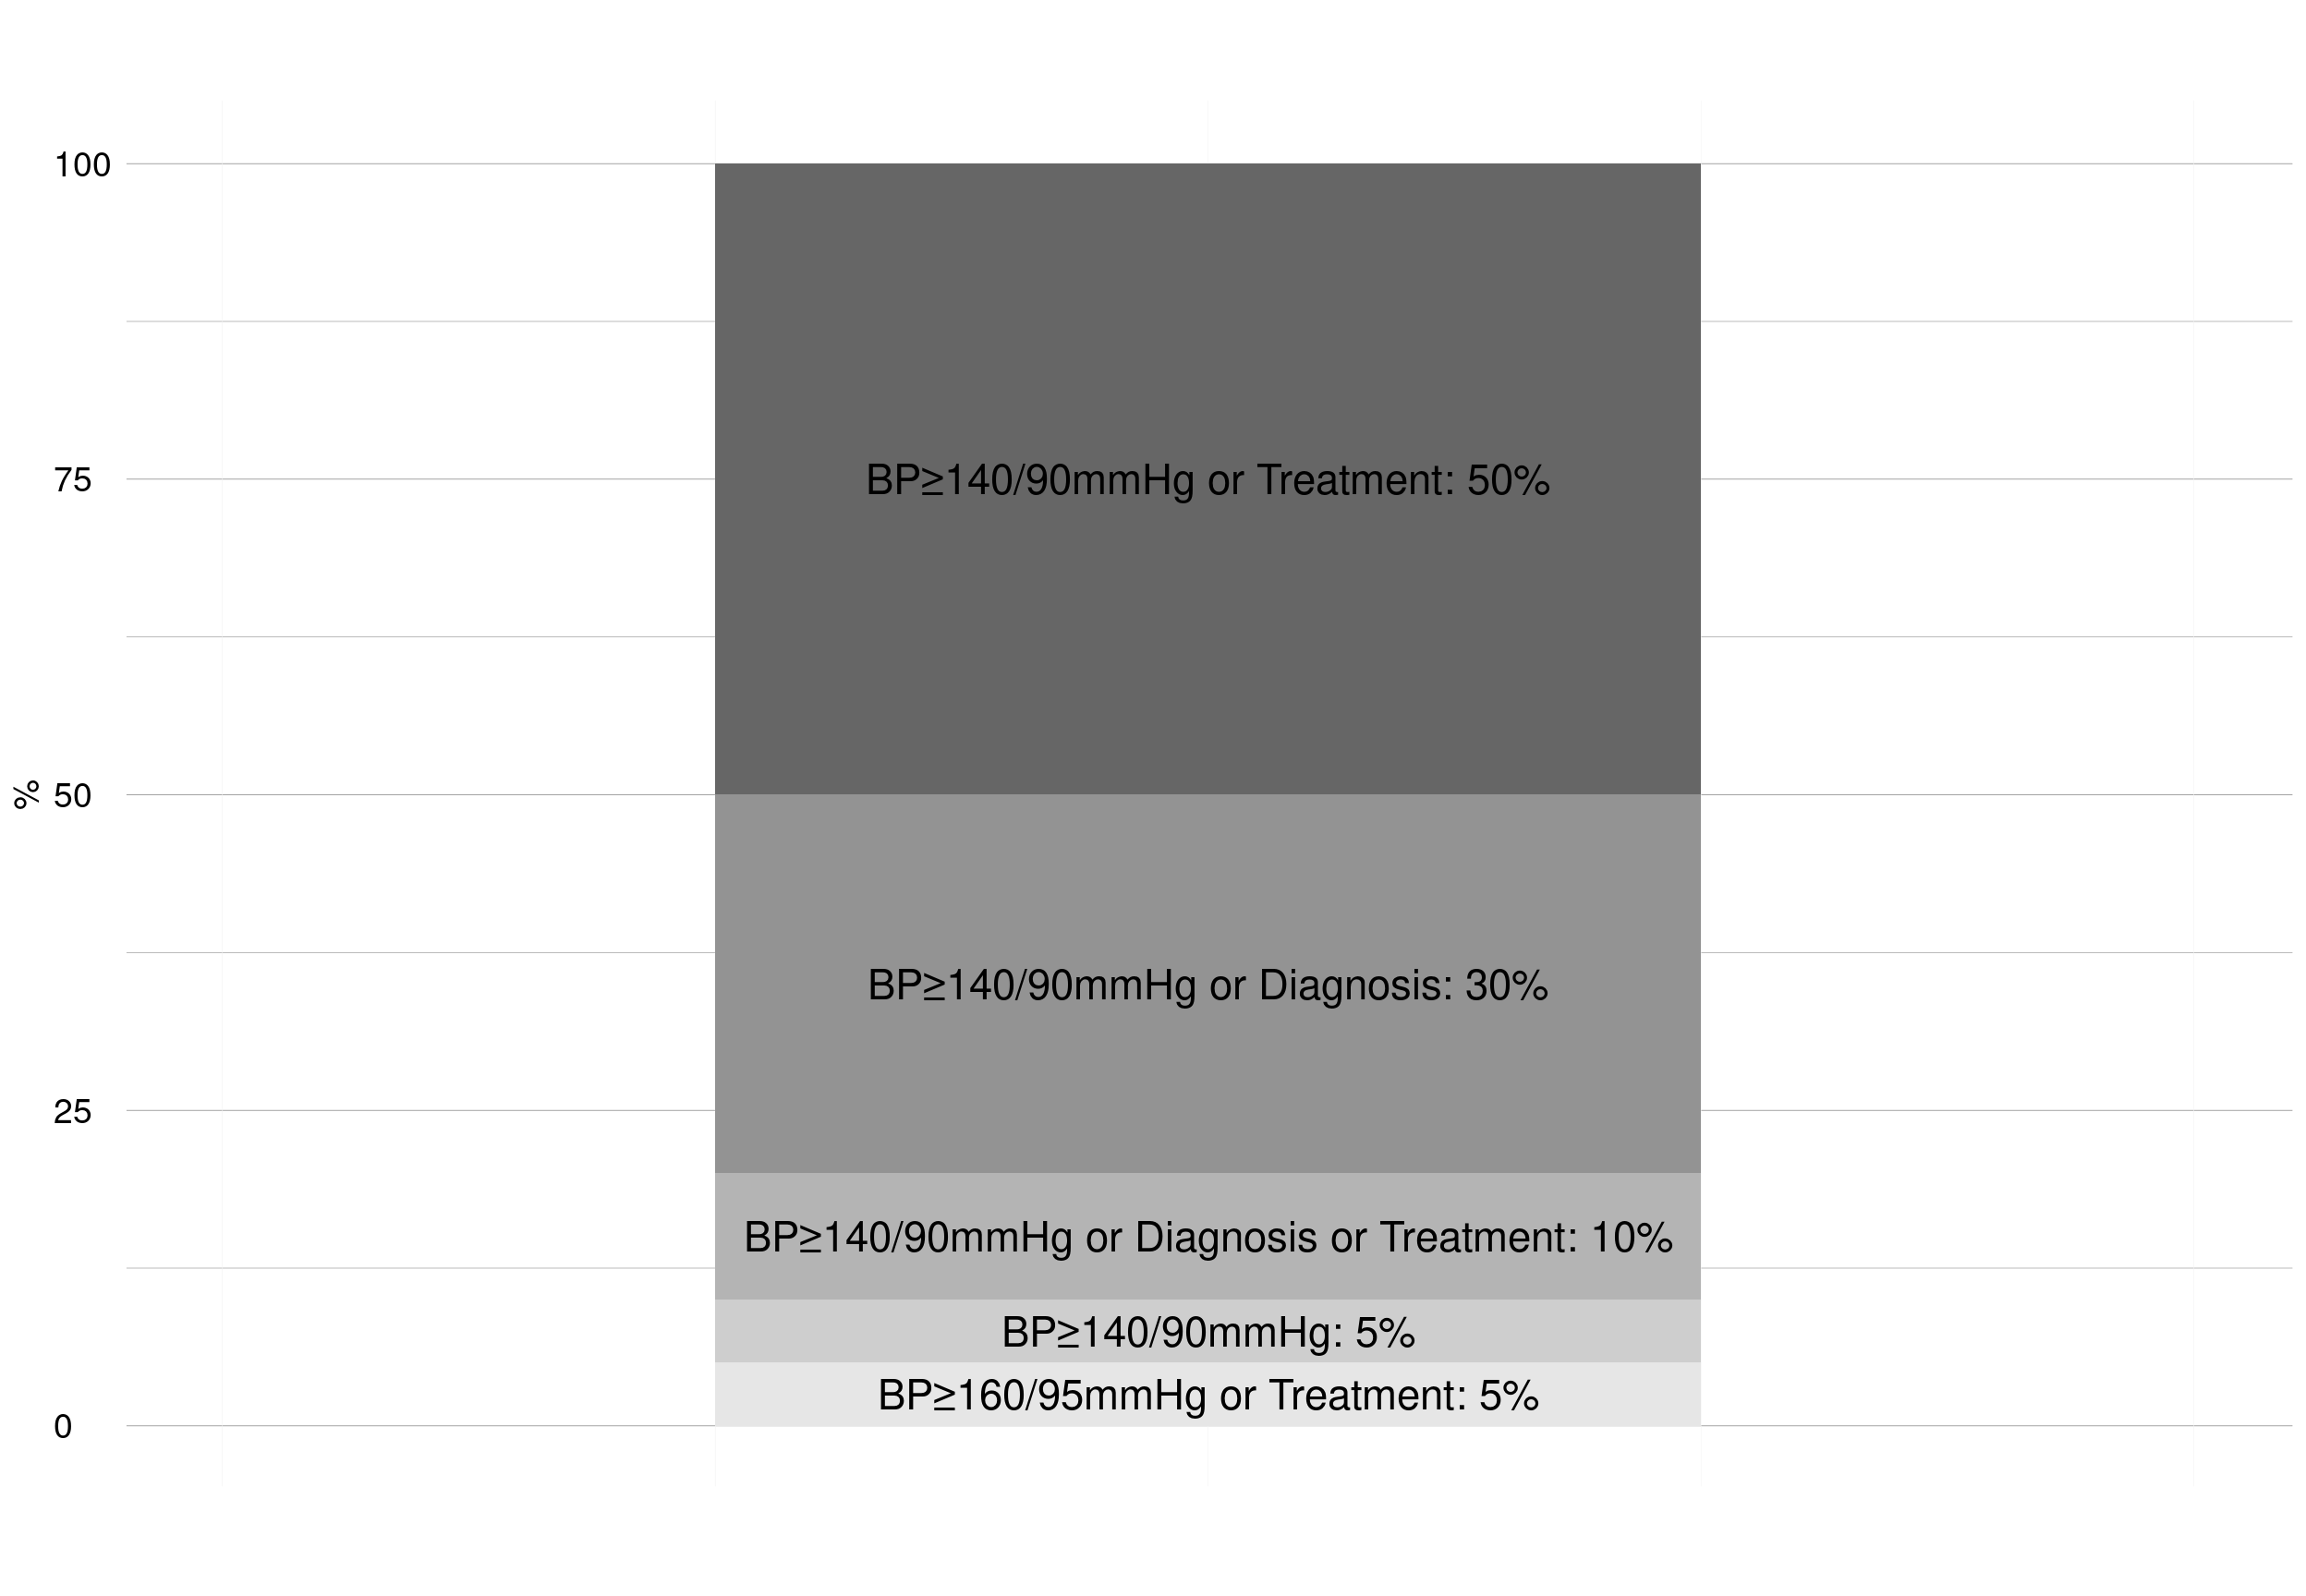
In Table 2. 2 I outlined five different definitions of hypertension. The most common definition of hypertension used by the included studies was definition 1: BP≥140/90mmHg or using antihypertensive medication (Figure 2. 13).
Figure 2. 13: Included articles by hypertension definition
Many of the included articles first reported on the overall levels of hypertension prevalence before presenting the levels of management among those classified as being hypertensive. Most sample sizes for hypertension prevalence were large, ranging from 461[20] to 45,300[25] participants (Figure 2. 14). Sample sizes for estimating hypertension management levels were smaller (Figure 2. 14 and Table A2.2 Appendix A2 as they are based on persons classified as hypertensive (e.g. awareness levels) or a subgroup of them (e.g. levels of control among those treated).
Figure 2. 14: Number of associations, minimum and maximum analytical sample size by outcome
| Outcome | variable | value |
|---|---|---|
| Awareness(H) | Number of associations | 38 |
| Treatment(H) | Number of associations | 16 |
| Treatment(A) | Number of associations | 8 |
| Control(H) | Number of associations | 21 |
| Control(A) | Number of associations | 7 |
| Control(T) | Number of associations | 13 |
| Awareness(H) | Minimum sample size | 95 |
| Treatment(H) | Minimum sample size | 95 |
| Treatment(A) | Minimum sample size | 300 |
| Control(H) | Minimum sample size | 95 |
| Control(A) | Minimum sample size | 290 |
| Control(T) | Minimum sample size | 270 |
| Awareness(H) | Maximum sample size | 14630 |
| Treatment(H) | Maximum sample size | 3809 |
| Treatment(A) | Maximum sample size | 3669 |
| Control(H) | Maximum sample size | 3809 |
| Control(A) | Maximum sample size | 3669 |
| Control(T) | Maximum sample size | 1560 |
Ten SEP measures were included in the search syntax (Figure 2. 4). However, only two markers of SEP, education and financial resources, were found in this review. Education was the SEP measure in 56/103 associations; financial resources was the SEP measure in 47/103 associations.
According to the WHO classification for measures of health inequality (2.3. 8),[21] 79/103 SEP-HM associations were assessed statistically by simple measures of inequality and 24/103 by complex measures of inequality (Figure 2. 15). Twenty-three of the 79 simple associations were age-standardised, to compare levels of hypertension management across the SEP groups after removing differences in their age distribution. Age and gender stratification or adjustment were made in all estimations using the SII and the concentration index (values in Figure A2.1 Appendix A2 and for 19/22 estimations using the OR.
Figure 2. 15: SEP-HM associations by type of inequality measure
| Type of inequality measure | Number of associations | ||
|---|---|---|---|
| Simple measure of inequality | Absolute | Difference (proportion descriptions or χ2 test) | 57 |
| Relative | Odds Ratio (OR) | 22 | |
| Complex measure of inequality | Absolute | Slope index of inequality (SII) | 12 |
| Relative | Relative concentration index | 12 | |
| Total | 103 |
Associations by awareness, treatment and control
Half of the articles (10/20) included in this review examined inequalities over the entire pathway of hypertension management (awareness, treatment and control). As mentioned in Figure 2. 14, the most reported SEP-HM association was Awareness(H) (n=38) followed by Control(H) (n=21) and Treatment(H) (n=16).
I. Levels of awareness, by SEP
Seventeen of 20 articles reported overall levels of awareness, all using the hypertensive population as the denominator (Awareness(H)), with levels of awareness ranging between 31% (Mexico, 2006[25]) and 87% (Brazil, 2005[24]). Thirty-eight SEP-Awareness(H) associations were found, with a higher proportion of pro-rich than pro-poor associations (24% and 11% of associations respectively, Figure 2. 16 ), especially when financial resources was used as the SEP measure.
Figure 2. 16: SEP-Awareness associations by socioeconomic factor

The studies conducted in Chile, Peru, Trinidad and Tobago, and Uruguay showed only non-significant SEP-Awareness associations. In Brazil, 2/8 of the SEP-Awareness associations were pro-poor, and 1/8 was pro-rich. The equivalent figures in Mexico were 1/14 and 6/14 respectively. In Colombia, one pro-rich, and in Argentina, one pro-poor association, was reported when financial resources was used as the SEP measure.
Few associations were stratified by gender. Of these, 5/8 associations were evaluated in females: two used education as the SEP measure (both non-significant) and three used financial resources (one non-significant, two pro-rich); 3/8 associations were reported in males: each used financial resources as the SEP measure (two non-significant, one pro-rich).
II. Levels of treatment, by SEP
Eighteen articles reported levels of treatment by SEP. Almost all the articles defined treatment based on the self-report of use of antihypertensive medication and did not use any external validation of these self-reports through, for example, checking the prescriptions in use. Only one article defined treatment by the prescriptions showed during the interview, using the anatomical therapeutic chemical (ATC) classification system to classify medications as antihypertensive or not.[30]
Two different denominators were used for calculating levels of treatment (see Figure 2.2): 7/20 articles used Treatment(H), and 5/20 used Treatment(A). Overall, Treatment(H) levels varied between 9% (Mexico, 2006[34]) and 85% (Brazil, 2005[24]). Half of the reported Treatment(H) levels were below 50%. Treatment(A) levels were generally higher, varying between 74% (Mexico, 2012[40]) and 91% (Chile, 2010[23]).
My review found 16 SEP-Treatment(H) and eight SEP-Treatment(A) associations: of these, 75% and 100% were non-significant, respectively (Figure 2. 17 ). Pro-poor and pro-rich SEP-Treatment(H) associations were found only with financial resources used as the SEP measure..
Figure 2. 17: SEP-Treatment associations by socioeconomic factor
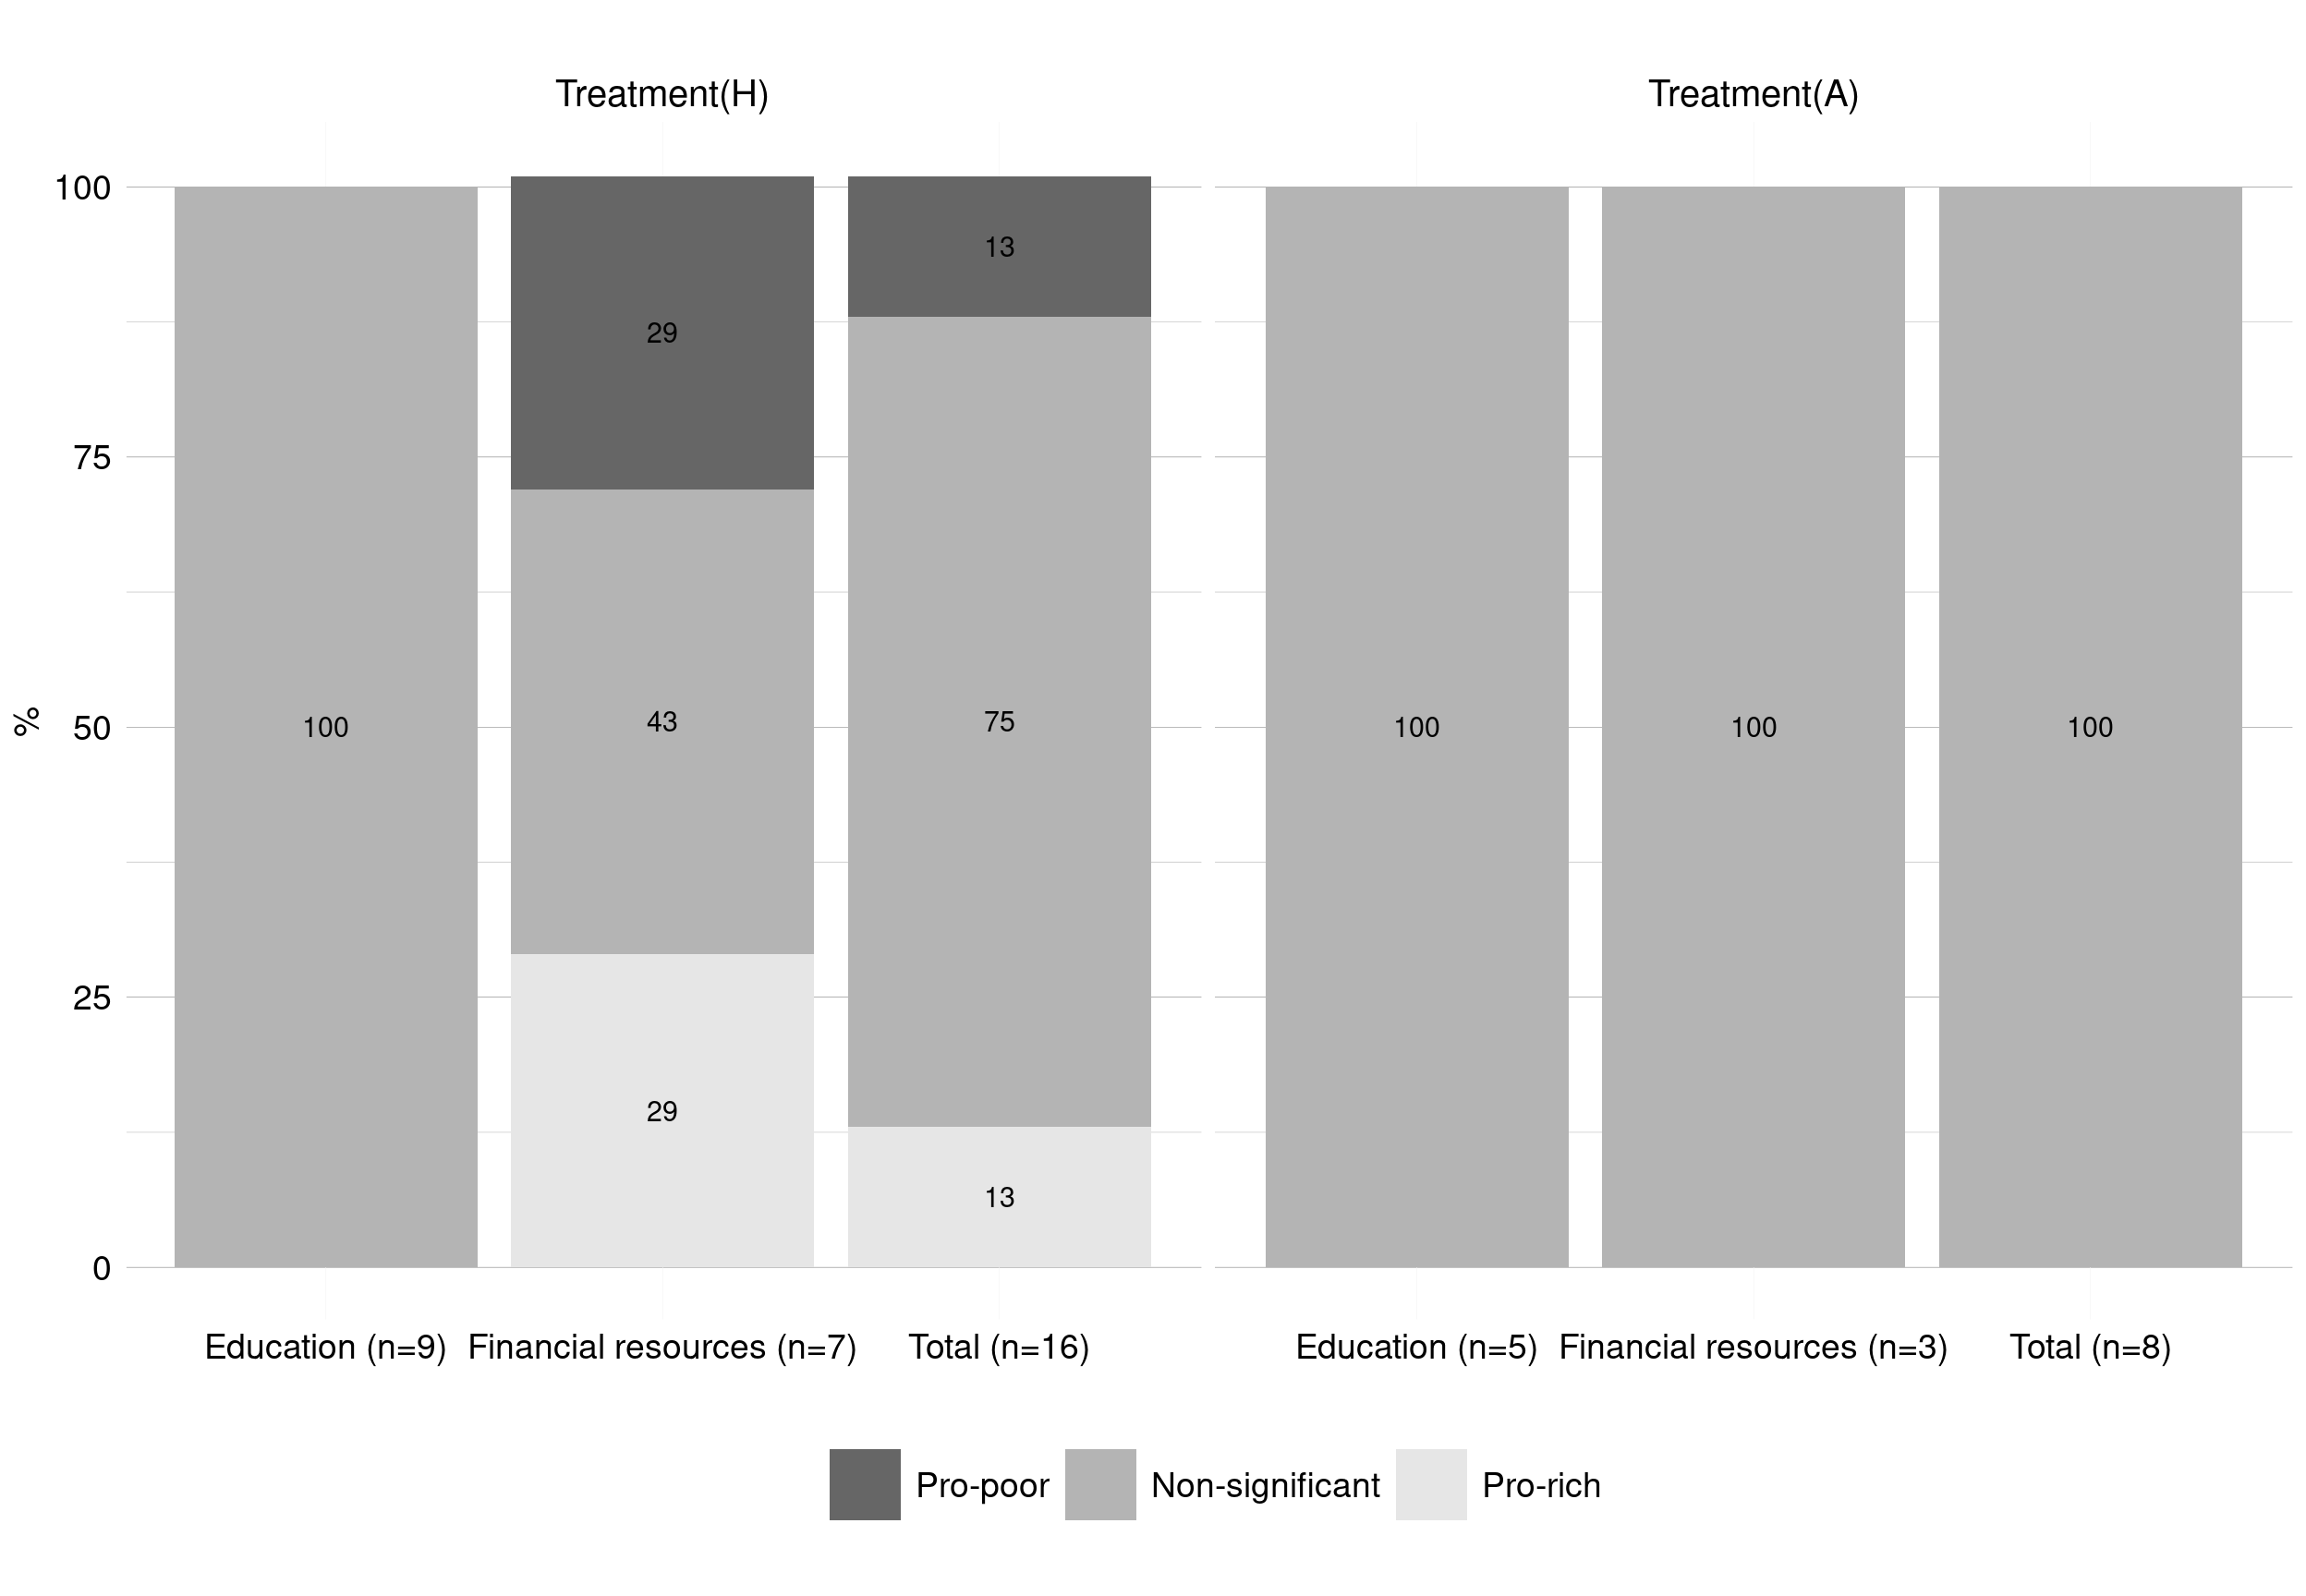 Argentina, Brazil, Chile, Peru, Trinidad and Tobago, and Uruguay reported only non-significant SEP-Treatment(H) and SEP-Treatment(A) associations. Mexico reported two SEP-Treatment(H) associations (one non-significant and one pro-rich using education and financial resources as the SEP measure, respectively). Colombia reported one pro-rich SEP-Treatment(H) association using financial resources as the SEP measure. Two non-significant associations between Treatment(H) and education were reported by gender (split between males and females).
III. Levels of control, by SEP
Sixteen articles reported SEP-Control associations. Almost all defined controlled hypertension as BP<140/90mmHg. Three different denominators for estimating levels of controlled hypertension were found (see Figure 2. 18): 10/20 articles reported Control(H), 2/20 articles reported Control(A), and 6/20 reported Control(T). Control(H) levels varied between 10% (Brazil, 1999[26]) and 59% (Peru, 2010[23]). Control(T) levels varied from 33% (Peru, 2007[41]) to 71% (Peru, 2010[23]).
Twenty-one SEP-Control(H), seven SEP-Control(A) and 13 SEP-Control(T) associations were found in the included studies. Most SEP-Control associations were classified as non-significant. Control(A) and Control(H) showed a similar distribution of pro-poor and pro-rich associations (Figure 2. 18). However, 23% of the SEP-Control(T) associations were pro-rich (i.e. higher levels of control among those hypertensives with higher levels of financial resources).
Figure 2. 18: SEP-Control associations by socioeconomic factor
 Looking at the associations over SEP as a whole, Brazil, Chile, Peru, Trinidad and Tobago, and Uruguay reported only non-significant SEP-Control(H) associations. Mexico reported four associations with Control(H), one pro-poor and three non-significant. Argentina reported two associations with Control(H), one pro-poor and one non-significant. Nicaragua reported two associations with Control(H), one non-significant and one pro-rich. Pro-rich SEP-Control(H) associations were reported in Cuba and in Colombia. Mexico was the only country which reported financial resources-Control(A) associations, with 1/7 being pro-poor, 5/7 non-significant and 1/7 being pro-rich. Argentina, Chile, Mexico, Peru, Trinidad and Tobago, and Uruguay presented only non-significant SEP-Control(T) associations. Brazil had 2/2 pro-rich SEP-Control(T) associations (split between education and financial resources as measures of SEP).
Fourteen SEP-Control associations were gender-specific, divided equally between males and females. Two SEP-Control(H) associations were reported for females (one non-significant, one pro-rich) and two were reported for males (both non-significant). Three SEP-Control(H) associations were reported for females (one pro-poor, one non-significant, one pro-rich) and three were reported for males (all non-significant). Two SEP-Control(T) associations were reported for females (both non-significant) and two were reported for males (one non-significant, one pro-rich).
SEP-HM associations assesed separately by education and financial resources
Only 7/20 articles described the SEP-HM associations separately by education and financial resources (Figure 2.11). Treatment(H), Control(H) and Control(T) associations showed similar results regardless of the SEP measure used. Awareness(H) showed a higher proportion of pro-poor associations with education, whilst a higher proportion of pro-rich associations was found with financial resources.
Figure 2. 19: SEP-HM associations in those studies using education and financial resources as separate measures

Associations by SEP, country and gender
Overall, the results of the 103 separate SEP-HM associations (regardless of the hypertension management outcome), showed 9% pro-poor, 74% non-significant and 17% pro-rich associations. Higher proportions of pro-poor and pro-rich associations were reported when financial resources was used as the SEP measure compared with education (Figure 2. 20).
Figure 2. 20: Overall SEP-HM associations by socioeconomic factor
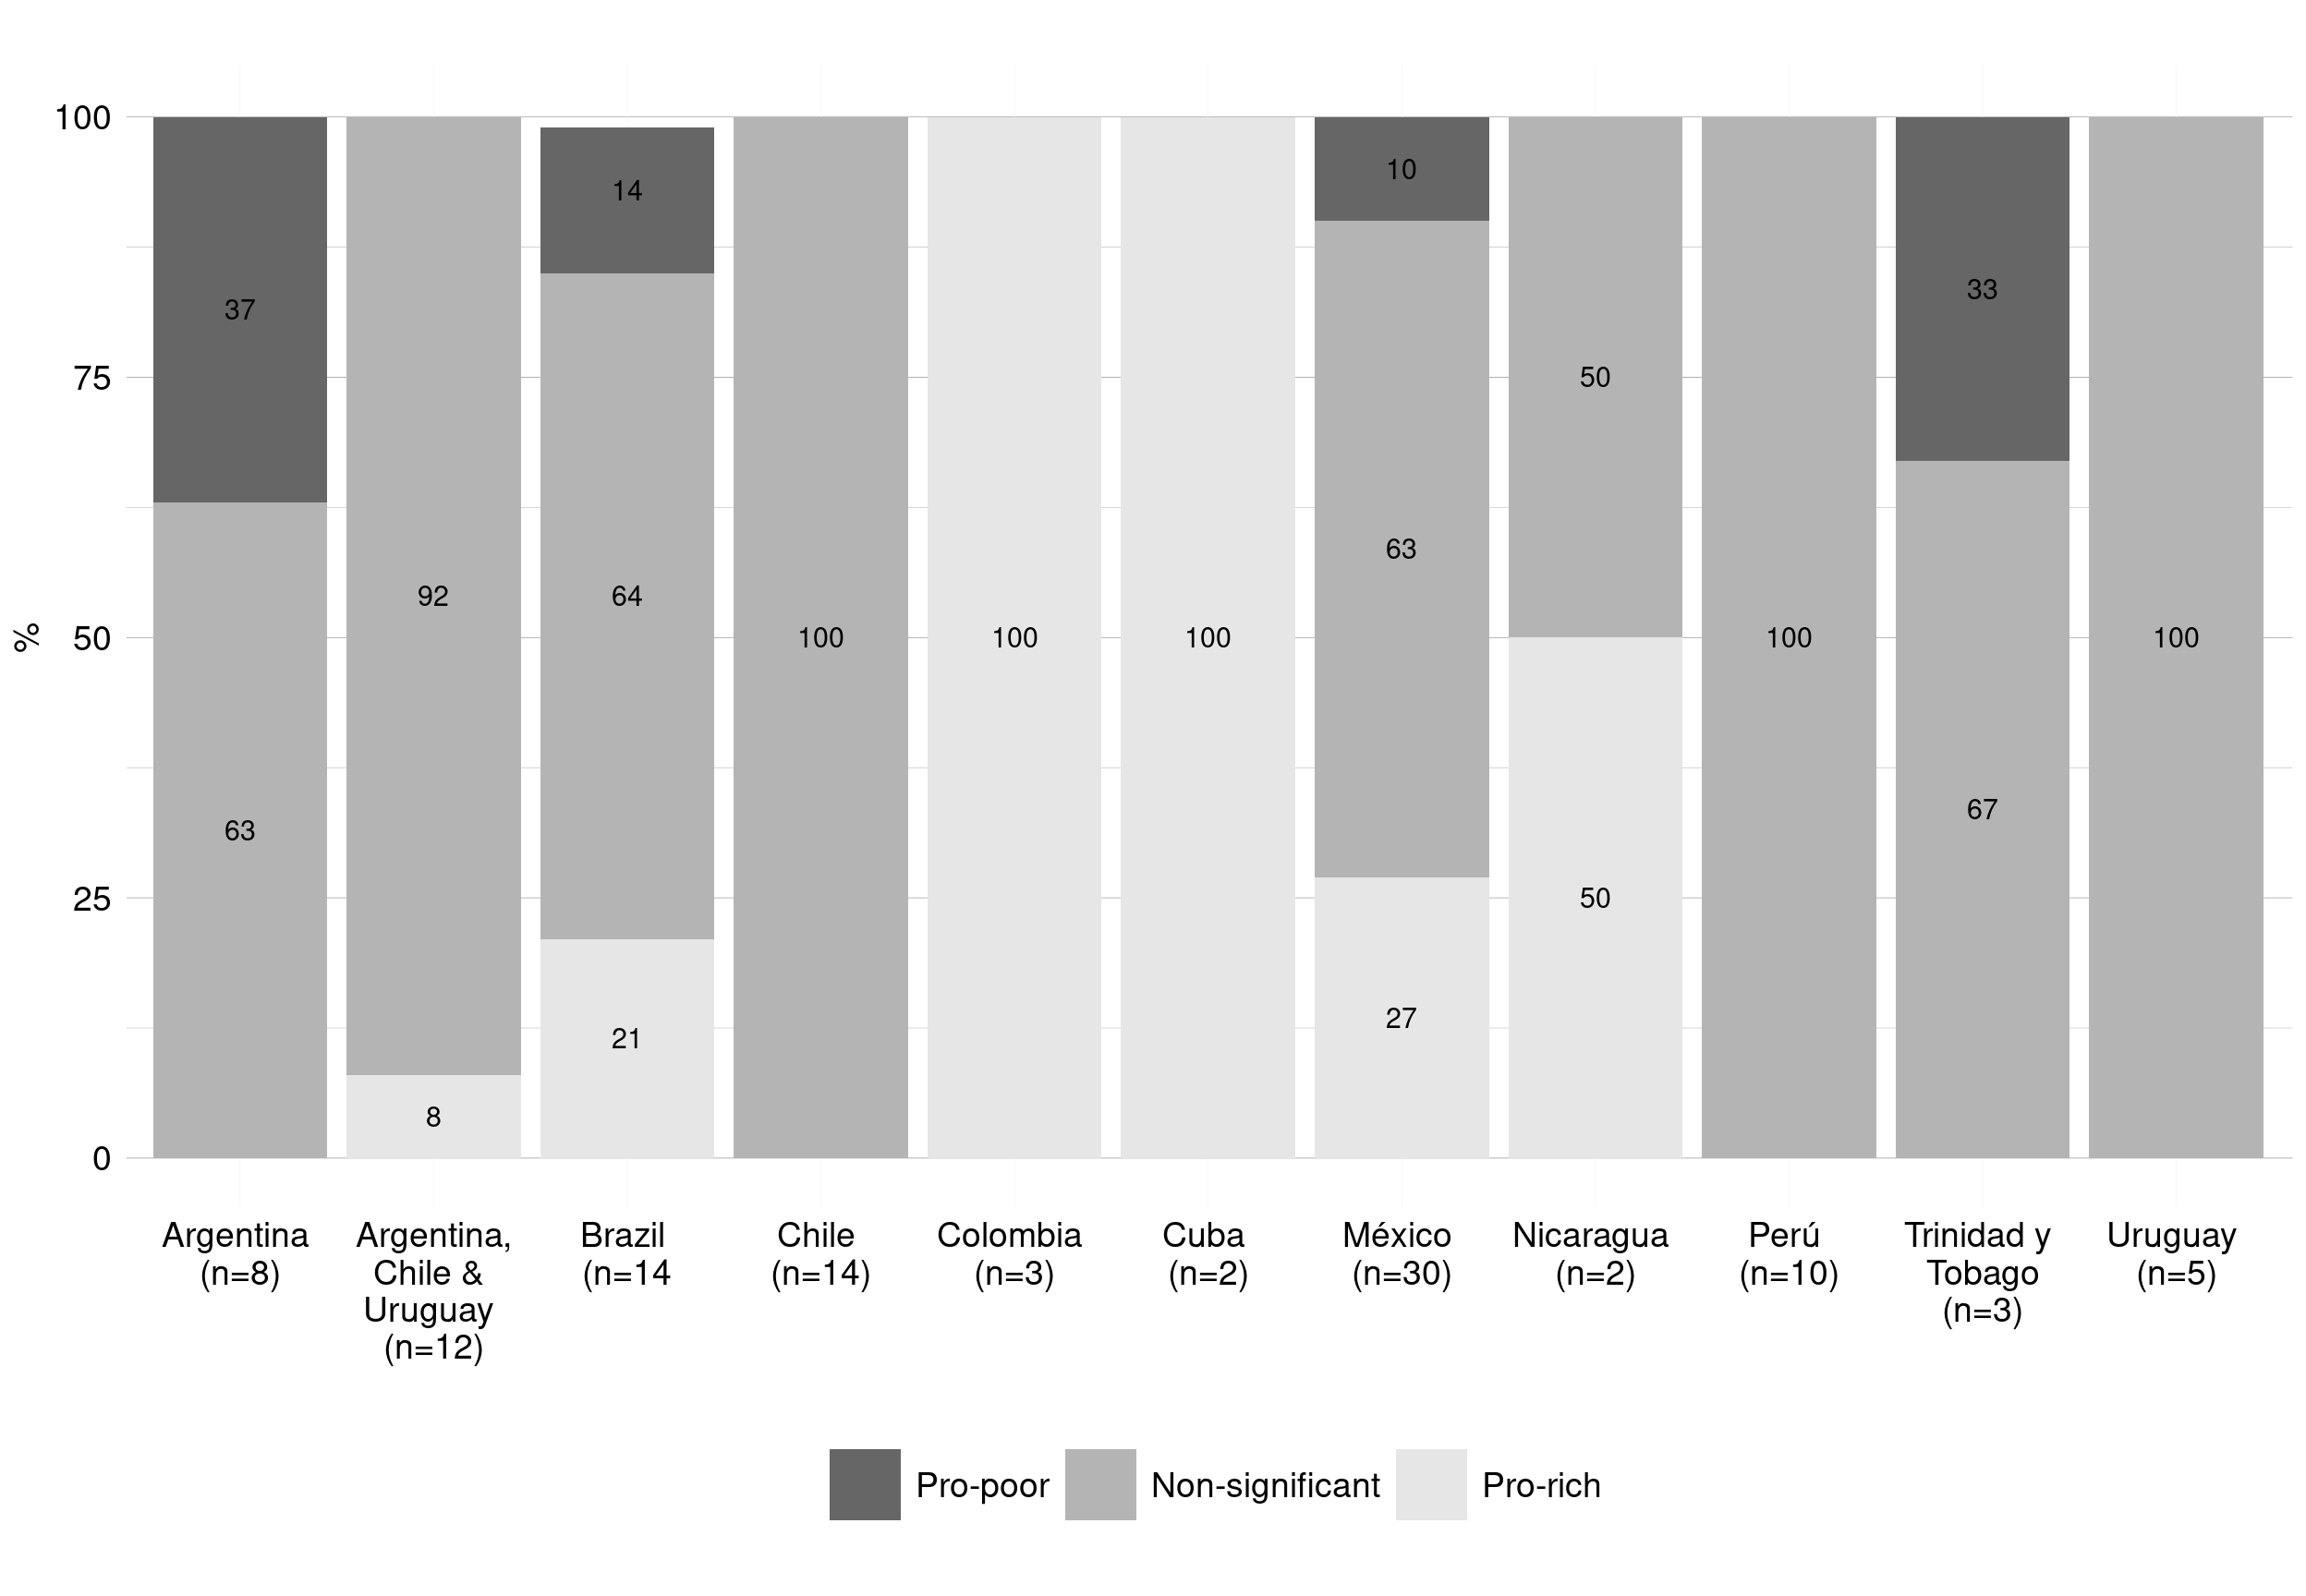
 SEP-HM associations were reported most commonly in Mexico, followed by Brazil, Chile and Peru. In Brazil, Colombia, Cuba, Nicaragua and Mexico, a higher proportion of pro-rich than pro-poor SEP-HM associations were found. Argentina, Brazil, México, and Trinidad & Tobago were the only LACcs reporting pro-poor associations. In Chile, Peru and Uruguay, all the SEP-HM associations were non-significant (Figure 2. 21).
Figure 2. 21: SEP-HM associations by country
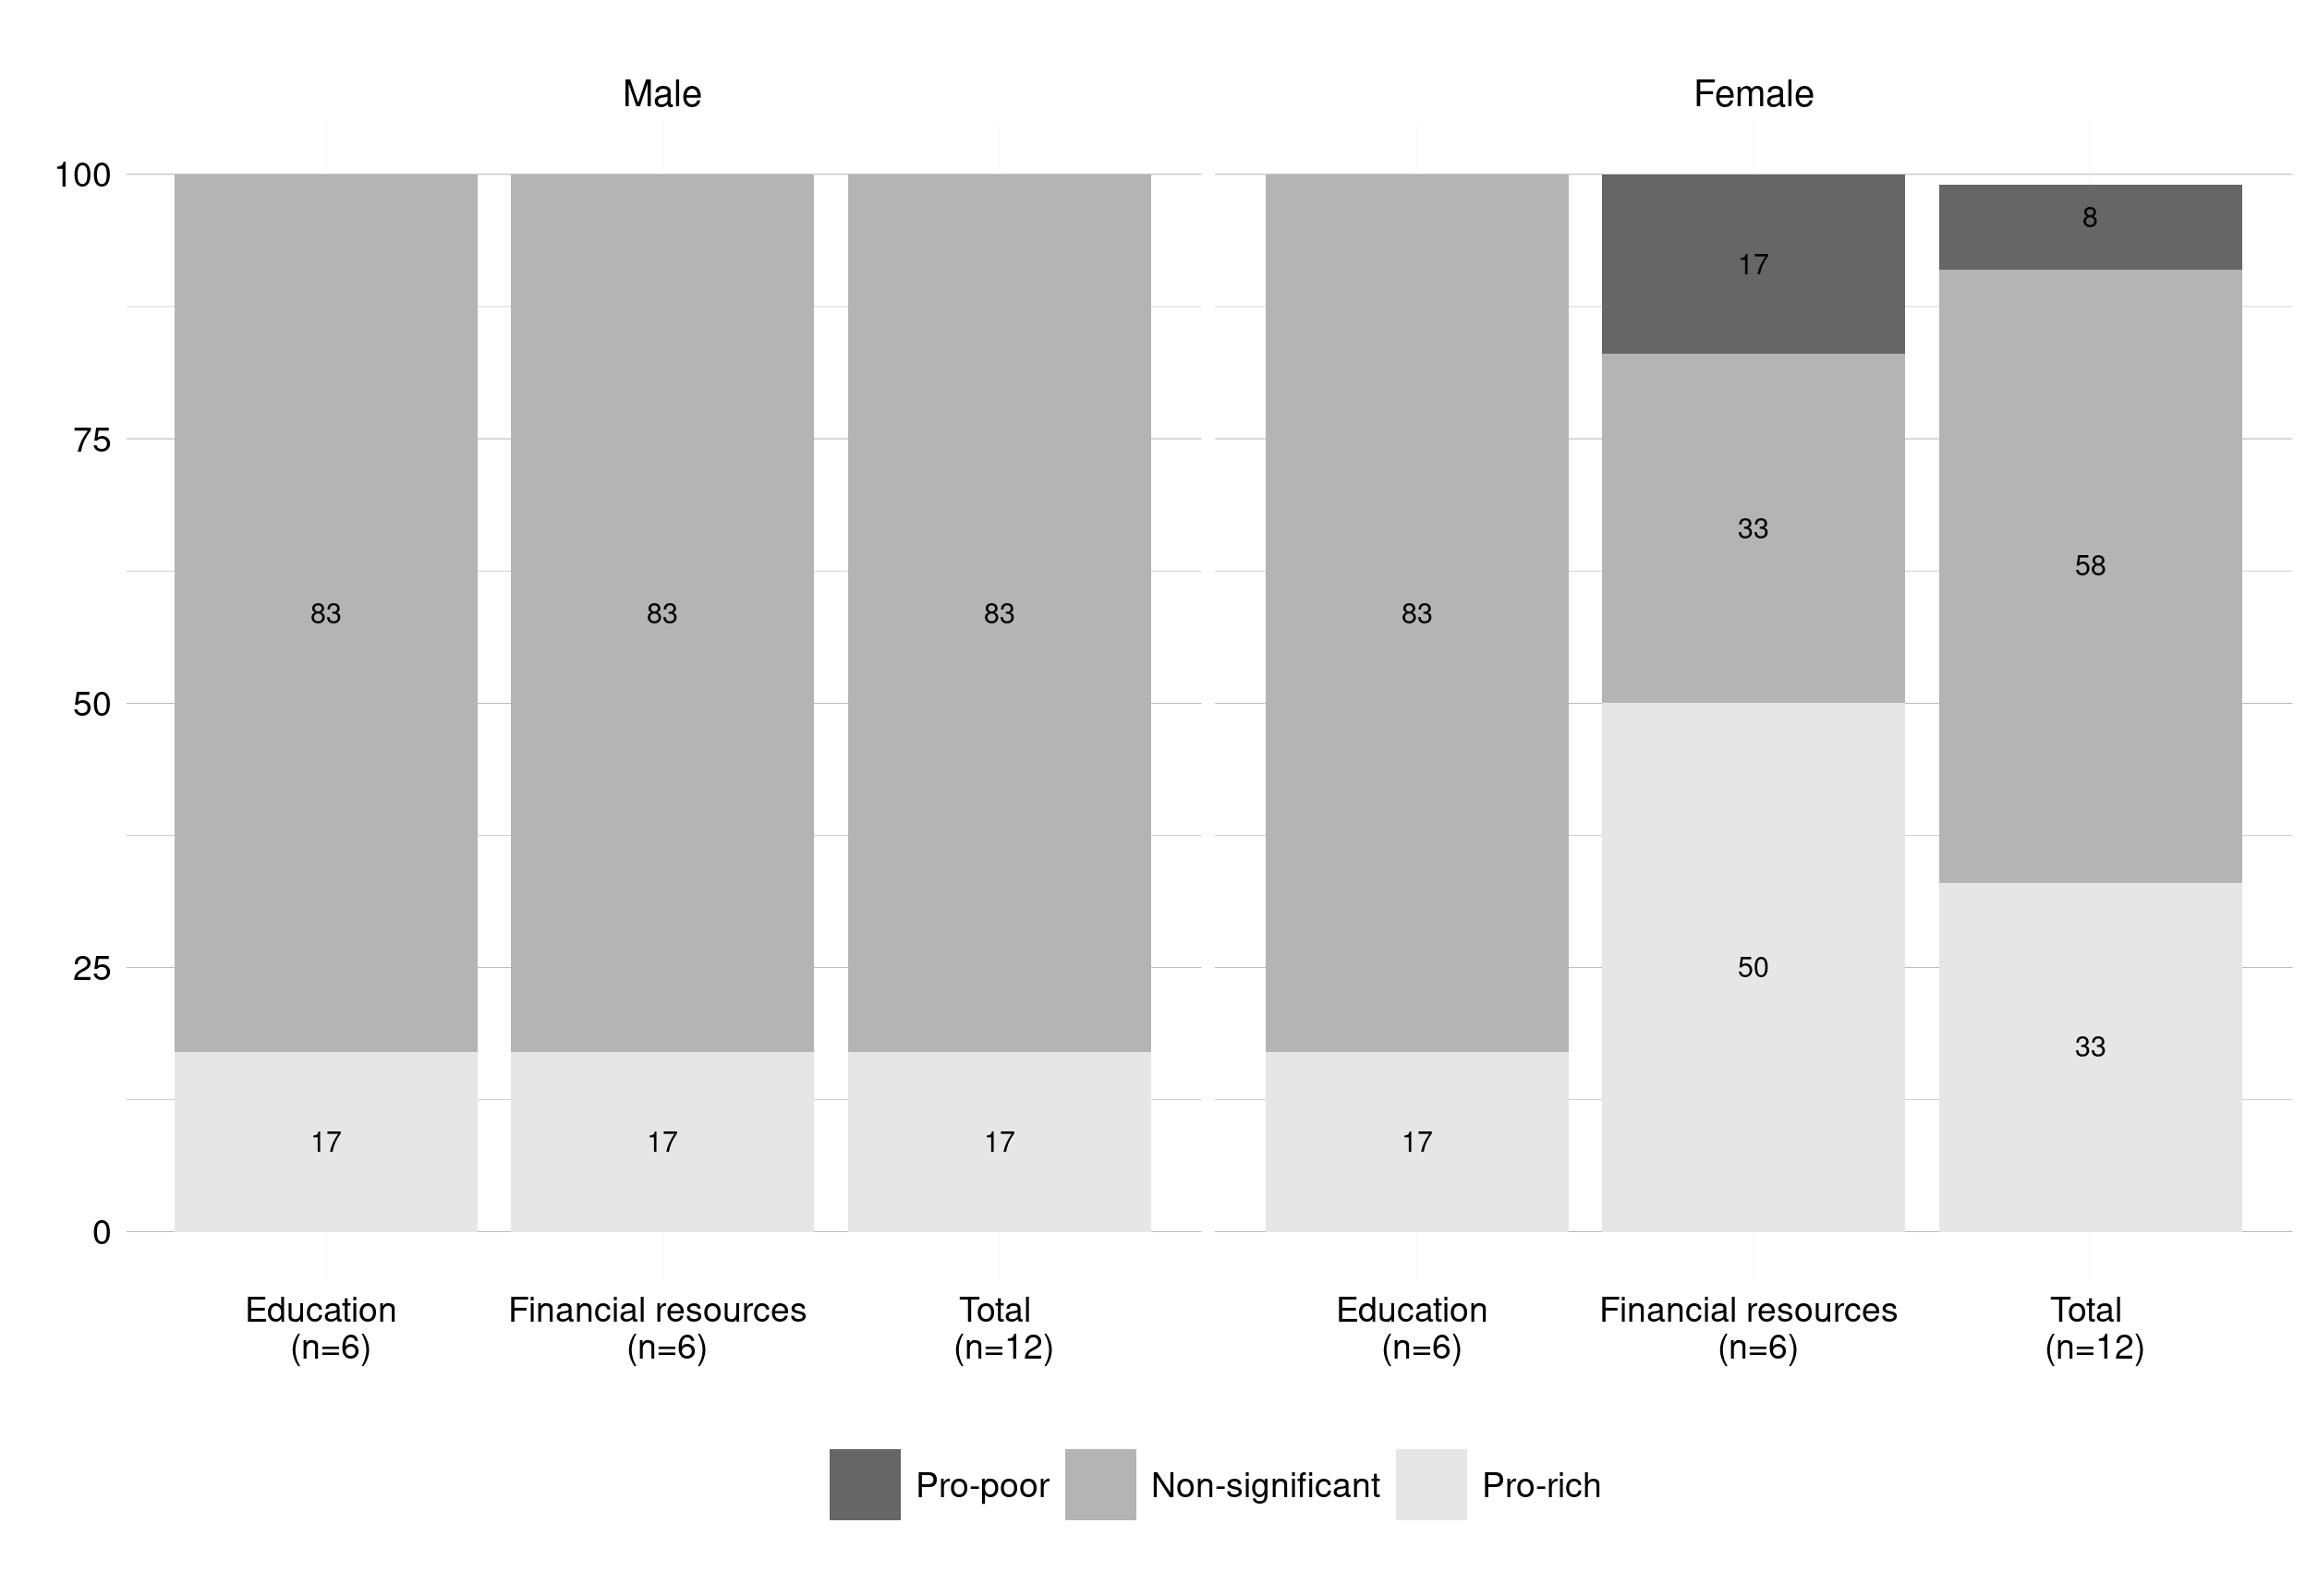
Only 4/20 articles[22, 25, 40, 43] reported gender-specific SEP-HM associations. Pro-poor associations were found only in females and when financial resources was used as the SEP measure (Figure 2. 22).
Figure 2. 22: SEP-HM associations by gender
 ### Quality sensitivity analyses
I performed a sensitivity analysis (Figure 2. 23) in order to examine the SEP-HM associations amongst those associations grouped by inequality measure (simple versus complex), age-adjustment (yes versus no), documentation of response levels to the survey (yes versus no) and reporting of sample size (grouped into categories).
SEP-HM associations (evaluated by Pearson’s chi-squared test) was statistically significant in three of the four quality tests. The proportions of non-significant SEP-HM associations were lower when complex measures of inequality (p=0.042) and age-adjustment were used (p=0.002). The proportion of non-significant associations was lower in studies that did not report the levels of response to the survey compared to those who did so (p=0.011). Seventy-four percent of the associations in studies with <500 participants were non-significant compared to 60% among studies with >2000 participants, but overall this was not statistically significant (p=0.450).
Figure 2. 17: Sensitivity analysis for the SEP-HM associations
| Sensitivity analysis | Pro-poor | Non-significant | Pro-rich | n | χ2 test p-value | |
|---|---|---|---|---|---|---|
| Statistical method | Simple measure | 6.0% | 80.0% | 14.0% | 79 | 0.042 |
| Complex measure | 17.0% | 54.0% | 29.0% | 24 | ||
| Response rate | Reported | 5.0% | 83.0% | 12.0% | 66 | 0.011 |
| Not reported | 16.0% | 57.0% | 27.0% | 37 | ||
| Adjusted by age | Yes | 13.0% | 57.0% | 30.0% | 47 | 0.002 |
| No | 5.0% | 88.0% | 7.0% | 56 | ||
| Sample size | ≤500 | 10.0% | 74.0% | 16.0% | 19 | 0.45 |
| 500-2000 | 7.0% | 80.0% | 14.0% | 59 | ||
| >2000 | 12.0% | 60.0% | 28.0% | 25 | ||
| Total | 9.0% | 74.0% | 17.0% | 103 |
Complementary to the test for the sample size shown above, in Table A2.4 Appendix A2 I outline the sample size for each of the SEP-Awareness(H) associations. Overall, there was a tendency to find more pro-rich and pro-poor associations in the studies with larger sample sizes.
2. 5. DISCUSSION
Key findings of the systematic review
The ‘rule of halves’ as a rule for hypertension in LACcs?
The ‘rule of halves’[44] states that approximately half of those patients with high BP have been diagnosed, half of those detected have been treated, and half of those treated have their BP levels successfully controlled. This rule is not the current reality for HICs nor LMICs. Evidence suggests that HICs have improved their levels of hypertension management since 1972,[45–47] presenting current levels according to a ‘rule of two-thirds.’[45] hypertension management levels in LMICs, however, have remained below the ‘rule of halves,’[10, 13, 36, 41, 48] so much so that a ‘rule of thirds’ was suggested by Lerner, using data from Peru.[41] Most of the articles included in this review presented management levels lower than 50%. The lower levels of hypertension management in LACcs affect all SEP groups (though not necessarily equally) and suggest pervasive problems, such as under-diagnosis, the presence of barriers to accessing appropriate treatment, and the provision of inadequate treatment (e.g. ineffective drugs, inadequate dosing, improper combinations of drugs) or non-adherence to therapy. More research is needed to understand the determinants of the low levels of hypertension management in LACcs.
Socioeconomic inequalities in hypertension management in LACcs
Disparities in hypertension prevalence are magnified by disparities in levels of awareness, treatment and control. The lack of information on socioeconomic inequalities in hypertension management is one of the barriers to reducing both the burden of hypertension and its unequal distribution. To the best of my knowledge, this is the first systematic review of the literature on socioeconomic inequalities in hypertension management in LACcs. However, SEP-HM associations could only be evaluated to date in ten of 19 LACcs Figure 2. 21. I found a mixture of pro-rich and pro-poor associations. Furthermore, a large proportion of the SEP-HM associations were classified as non-significant. However, it is important to note that non-significant associations do not necessarily imply “true” equality. Non-significant associations could arise if inequalities were not linear (e.g. the middle SEP was significantly different but not the extremes) or due to analyses having low statistical power, reflecting imprecision for survey estimates due to low sample sizes. Achieving sufficient statistical power to detect “true” differences in hypertension management levels across SEP can be difficult for subgroup analyses of nationally-representative health examination survey data.[49] Medium to large differences in levels of hypertension management between SEP groups may fail to achieve statistical significance if the sample sizes among those classified as hypertensive are small to moderate.[50] Furthermore, whilst I prespecified a significance threshold (P<0.05) before conducting my review, it is an arbitrary cut-point: P values are continuous (ranging from 0 to 1), and as such their interpretation should be a continuum. [51]
Most research to date analysed Control(H) as the main indicator of hypertension management, followed by Awareness(H), and Treatment(H). Educational level and financial resources (i.e. income) were the only measures of SEP used to asses socioeconomic variations in levels of hypertension management.
Due to the small number of articles quantifying the magnitude of associations and due to the heterogeneity in statistical approaches (e.g. method of adjustment or reporting of results), only the statistical significance of the SEP-HM associations was evaluated in this review. Therefore a meta-analysis (i.e. a systematic approach to combining the results of relevant studies to arrive at conclusions about a body of research[52]) could not be performed.
My study has found that patterns of socioeconomic inequalities in hypertension management are perhaps more complex and challenging to interpret than those for hypertension prevalence. The direction of socioeconomic inequalities in hypertension management (pro-poor, non-significant or pro-rich) in LACcs differs considerably by outcome, country, gender, and marker of SEP. Nevertheless, there are some underlying patterns in the body of evidence to date.
Awareness
With regards to awareness (prior diagnosis of high BP by a health care professional), the proportion of pro-rich associations was higher than pro-poor. Amongst hypertensives, the lower levels of diagnosis in low SEP groups demonstrates the importance of objective measurements of BP within nationally-representative HES and not relying exclusively on self-reported diagnosed hypertension or surveys solely conducted among users of healthcare services.[53]
Treatment
With regards to treatment (use of antihypertensive medication), inequalities were found with Treatment(H) as the indicator, but not with Treatment(A). The latter finding could reflect a lack of statistical power (e.g. smaller samples when restricted to those aware). Alternatively, it could be that after limiting the denominator to those with a previous diagnosis (and so have had some access to healthcare), there is a “true” non-significant distribution between SEP groups in treatment levels. Mixed results of financial resources-Treatment(H) associations were reported, with pro-rich associations reported in Mexican and Colombian populations, possibly reflecting the unaffordability or the unavailability of cardiovascular drugs for hypertensive persons in lower SEP groups.[54–56]
Control
With regards to control (BP levels below thresholds such as<140/90 mmHg), there was a tendency to find more pro-rich than pro-poor associations with Control(T). Higher financial resources could improve access to better treatment (e.g. more optimal combinations and dosage of drugs) or improve adherence to treatment compared with hypertensive persons in lower SEP, hence increasing inequalities in control levels.[57] Each SEP-Control(A) association found in this study was from Mexican populations: one pro-rich (2003), and one pro-poor (2006).[25] Potentially, this shift in the direction of associations could be the result of the increase in health insurance coverage that occurred in Mexico with the health reform of 2003, when the ‘System for Social Protection in Health’ began.[58] I anticipate updating these results when studies using ENSANUT data from 2016 are published. [56]
Country-specific SEP-HM associations
As reported by Murphy et al, [54] country levels of health care expenditure (e.g. as a % of GDP) are a reliable predictor of inequality in the treatment coverage of secondary prevention for cardiovascular disease. According to my review, Mexico was the country with the most research to date on SEP-HM inequalities in LACcs, and one with the highest proportion of pro-rich associations. This could be related to its lower health care expenditure compared with other LACcs: according to World Bank data, Mexico in 2016 spent 6% of its GDP on health, while the other countries included in the review spent an average of 7%.[59] Furthermore, the proportion of health expenditure increased in Mexico from 5% of GDP in 2000 to 6% in 2016[59]; this is in agreement with the report of smaller SEP inequalities in the most recent studies.[25]
Financial resources and education as a SEP measure
This review found a higher proportion of pro-rich and pro-poor inequalities with financial resources used as the SEP measure when compared with education. However, the distribution changed between countries and mixed results within a country were found when comparing SEP measures.[60] For example, studies of the Brazilian population showed mixed results in SEP-HM associations: non-significant associations were found using financial resources as the SEP measure, whilst pro-rich associations were found using education.[30] The universal public health system in Brazil and its Family Health Strategy deliver targeted healthcare to individuals with low income,[61] with a demonstrated reduction of inequality in healthcare access.[62] Conventional treatments are often free of charge, and the programme provides community-based services improving health access and treatment adherence for those with fewer resources.[61] In this way, in Brazil and in other countries with universal coverage and strategies to reduce social inequalities in health and in health care, financial resources (as measured for example through current income) might not be the primary factor related to inequalities in HM.[15] However, variations in educational level might impact on levels of access to the health system and may impact on levels of treatment adherence, with more educated groups having not only higher levels of economic support but also higher levels of knowledge about health conditions, health-related behaviours, and more social and psychosocial resources than the least educated.[63] This may be particular important as hypertension is frequently asymptomatic in its early stages, and as a result education may be a particular important factor in influencing the likelihood that persons with high BP are diagnosed as having the disease.[64] Furthermore, education has been identified as a more robust measure of SEP than financial resources, as it is more easily and accurately measured and classified and is more stable over time.[65, 66]
More research is needed to understand the pro-rich inequalities in Control(H) reported in Cuba, a country well-known for its low levels of inequality and high levels of education and healthcare.[67] These findings were not discussed by the authors.[32]
Gender-specific SEP-HM associations
There is no reason to expect SEP-HM associations to be similar for males and females. However, reports of gender-specific variations in the SEP-HM associations are scarce. Since only a few studies reported gender-specific associations, no definitive conclusions about gender differences in the direction of SEP-HM associations can be made. However, the findings of my review suggest that pro-poor inequalities in LACcs were more common in females than in males. The evidence related to gender and SEP inequalities in this review and elsewhere highlights the need to report SEP-HM associations separately by gender.[64, 68, 69]
Principal statistical methods used to evaluate SEP-HM associations
The use of complex measures (e.g. SII, RII) is recommended to quantify the magnitude of inequalities as they consider information on all SEP groups (not just the extremes) and reflect the direction of the gradient (assuming a linear relationship).[21, 70] However, simple measures of inequalities that do not consider the whole SEP spectrum (e.g. pairwise comparisons such as odds- or prevalence-ratios to compare the highest and lowest SEP groups) should also be reported as a broader, non-technical audience understands them.[71] The SII and the concentration index were the only complex measures of inequality reported in the studies included in this review.
Furthermore, it is recommended to report both absolute (e.g. SII, absolute concentration index) and relative (e.g. RII, relative concentration index) measures of inequality when feasible as they represent different aspects of inequality.[72–74] Inequalities may be higher on the relative rather than absolute scale if overall levels of hypertension management are low.[75, 76]
A broader understanding of SEP inequalities requires first describing the actual levels of hypertension management and reporting the magnitude of inequalities without any adjustment, and second, to adjust for, or stratify results by, age and gender. No article in this review showed the magnitude of the effect on SEP-HM associations before and after controlling for age, gender or any other risk or protective factors. Therefore, I could not identify the impact of these potentially confounding variables on the SEP-HM associations. Among HICs outside LACcs, higher levels of awareness and treatment were reported with higher BMI,[15] and prior diagnoses of diabetes, CVD and chronic kidney disease.[77, 78] Potentially, these conditions, which are typically more prevalent in lower SEP groups, may increase the frequency of accessing health-care services, and as a result, increase the levels of BP monitoring within primary care for example.[79] In the UK, recent evidence suggests that social inequalities in hypertension prevalence co-exist with equitable delivery of indicators of healthcare such as antihypertensive medication use.[80] Likewise, recent analyses of Health Survey for England data showed that income-based inequalities in hypertension prevalence coexist with equity in levels of undiagnosed hypertension.[81]
Furthermore, no article compared the independent effects of different types of SEP (and their correlation) on the SEP-HM associations. Conclusions are very likely to differ after accounting for important confounders and other SEP indicators.[82]
Strengths and limitations of the systematic review
One of the strengths of this review is the systematic exploration of different indicators of hypertension management (representing the key stages in the hypertension management pathway) and SEP indicators in LACcs. However, some limitations need to be considered when interpreting the results.
Although several null findings were reported in the reviewed studies, publication bias remains a potential source of bias. Also, most of the associations were based on cross-sectional data, meaning causal inferences cannot be made.[83] HM outcomes were evaluated among the hypertensive population or a subpopulation of them (e.g. among those treated). Because of the low sample sizes typically available in national HES, most associations were likely to be statistically underpowered, and therefore moderate SEP variations in hypertension management levels would fail to achieve statistical significance at conventional levels. This could explain at least in part the high proportion of non-significant associations. According to this review, there was a tendency for a higher percentage of non-significant associations when the sample sizes were smaller. This is especially important when the SEP indicator is used in the analysis as a categorical rather than continuous variable.
Sample sizes in subgroups are reduced further when analyses are gender-specific. Most of the sampling designs for the largest nationally representative HES in LACcs, such as Encuesta Nacional de Salud (ENS) in Chile, ENcuesta de SAlud y NUTrición (ENSANUT) in Mexico, and Pesquisa Nacional de Saúde (PNS) in Brazil (see Figure A2.3 and Table A2.4 Appendix A2), are not designed for this type of sub-group analysis; they are usually representative of broader demographics groups (as gender, geographical regions, age groups). Moreover, sample sizes may be associated with variations in levels of response across SEP groups (usually lower in lower SEP groups),[84, 85] however, most population-based surveys do attempt to compensate for any SEP biases in non-response through weighting adjustments.[86–88]
By analysing the data at the SEP-HM association levels (rather than study level), more weight was given to those studies that reported more associations. Also, I summarised SEP-HM associations in a single analysis that in some cases covered a reasonably large time period (e.g. 2000-2016 in Mexico). This could have masked changes in the hypertension management levels, SEP distributions and SEP-HM associations over time within a LAC country. Associations between SEP and hypertension management may differ over time,[89] partially limiting the interpretation of some of the results in this review.
Different hypertension definitions could have affected the comparability of the articles included in this review. However, the inclusion criterion of using BP measurements to identify the hypertensive population standardised most of the definitions. Excluding those articles based only on self-reported diagnosis decreased the risk of report bias linked to undiagnosed hypertension between and within populations, potentially related to systematic differences in levels of contact with the health care system. The definition of hypertension based only on self-reported diagnosis by a health care professional understates levels of “true” prevalence (which includes both diagnosed and undiagnosed cases), especially among persons in lower SEP groups.[90, 91]
Other methodological differences between the included studies could also have influenced the results. The sensitivity analyses within this review helped to some extent to understand how some of these differences affected the main conclusions about SEP-HM associations in LACcs. For example, a larger proportion of pro-poor and pro-rich associations were described when analyses were age-adjusted and were summarised using complex rather than simple measures of inequality.
Gaps and implications for my PhD research
This systematic review has highlighted the need for a country-specific analysis, as differences in economic circumstances, and differences in levels of healthcare provision and access prevent extrapolation from other countries’ data. The differences in the direction of the associations related to the choice of SEP measure highlights the importance of evaluating inequalities in hypertension management using several SEP measures. The articles included in this review used only education level or financial resources as the SEP measure. However, there is a need for a more comprehensive understanding of SEP by using markers of more contemporary economic status. Both education and financial resources will be used as SEP measures for my PhD, but I will also use measures of occupation and employment status.
As the SEP-HM associations could change in magnitude and direction with time within the same population,[69] it is relevant to analyse whether any inequalities in hypertension management outcomes have changed over time in Chile using data from the three available ENS (2003, 2010 and 2017).
Differences in data analysis have contributed to variability in published data: to reduce this, standard surveillance definitions were proposed for hypertension prevalence and control.[92] As shown in this review, the diversity of outcome definitions reflect the need for evaluating inequalities in hypertension management using different denominators. In this way, I shall explore the sensitivity of inequalities to the choice of denominator. For example, although it is recommended to estimate levels of control (e.g. BP <140/90mmHg) among people with hypertension,[93] I will also estimate control levels among those on treatment. The most advanced statistical methods identified in the review were the SII and concentration index; however none of the studies presented inequalities on both the relative and absolute scales – and using both simple and complex measures - as recommended in the health inequalities literature.[72] In my research I will report both simple and complex measures of inequalities on both the absolute and relative scale.
Only a few articles reported SEP-HM associations stratified by gender. In my PhD, I will explore gender differences in socioeconomic inequalities in HM, although the gender-specific associations could be statistically underpowered. I will explore if data from ENS2003, ENS2010 and ENS2017 could be combined to increase subgroup sample sizes.
No article included in the review compared the effect of different models on the magnitude of the SEP-HM associations (e.g. before-and-after age adjustment). During my PhD I will test different models, to control and quantify the impact of potential confounders or moderators on the SEP-HM associations.
Prevalence studies are useful to understand SEP inequalities, as they allow researchers to quantify SEP differences, to compare SEP inequalities within population subgroups (e.g. by gender, age, risk factors) and between different populations, and to examine trends over time. In this context, I will take great care to define outcomes and use statistical approaches to ensure comparability with other nationally-representative studies of SEP inequalities in HM, like those described by this review in LACcs or by the literature elsewhere (e.g. USA,[94] Korea,[15] or India[95]).
This review will be updated every six months: potentially more recent data, hypertension definitions (e.g. AHA 2017[96]), SEP indicators or statistical methods will be reported in the following months.
2. 6. CONCLUSION
In summary, the prevalence of hypertension varies widely in different communities across selected LMICs. Awareness, treatment and control levels also differ widely within LACcs. Overall, the low levels of hypertension management highlight the need to increase investment in health and the development of universal health care programmes in LACcs.
Empirical data on SEP-HM associations are scarce in LACcs. The directions (pro-poor, non-significant and pro-rich) of inequalities in hypertension management management are mixed and vary according to factors including choice of SEP measure (e.g. education or financial resources); outcome definition (including the choice of denominator for the calculation of prevalence); and the statistical method (e.g. adjustment for potential confounders such as age). There is a clear need for an in-depth understanding of the magnitude and the direction of socioeconomic inequalities in hypertension management in Chile.
References