1. Introduction
1. 1. Background
This chapter introduces my research area and outlines the background and rationale for my PhD. It is divided into two sections. In the first one, I briefly describe my framework of the social determinants of health and I give an overview of Chile and its main characteristics; and in the second section, I describe the global relevance of hypertension and the Chilean evidence on its prevalence, care cascade, risk factors, policies and guidelines.
1.1. 2. CHILE OVERVIEW
1.1.2. 1. Structural drivers
Political, social, cultural and economic structures
Chile, a country of 17.6 million inhabitants (2017) with 11.4% aged 64 years and over and with 37.4% living in the Metropolitan region (Santiago, Figure 1. 2), has currently one of the most prosperous economies in Latin America (ranked by the World Bank as a HIC since 2012) but at the same time has a very low level of health expenditure (8.9% of gross domestic product: GDP).[4]
Figure 1. 2: Population size by geographical location. Chile, 2017
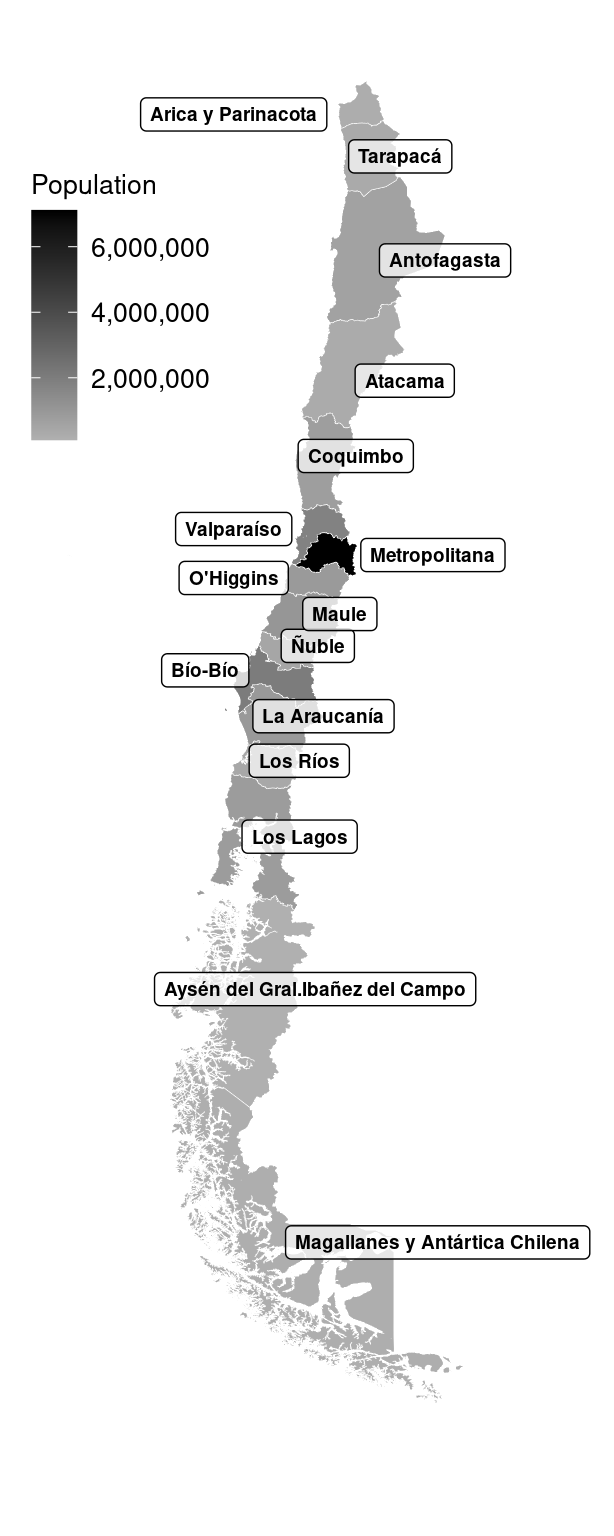 Source: INE (2017).[5]
The Political Constitution of 1980 established that Chile is a unitary state, with a democratic republic. The Constitution established that the administration of the State is functionally and territorially decentralised (into 15 regions). The President of the Republic is the Head of State. Sebastián Piñera (independent, centre-right wing) was elected in 2017. In 2020 a national plebiscite was held to decide whether a new constitution should be drafted and how should be drafted. Almost 80% agreed to draft a new constitution written by members elected directly for this convention.
The Chilean economy is characterised by being open to free trade and is one of the countries with the most signed treaties worldwide. It is a member of the Organisation for Economic Co-operation and Development (OECD). Chile ranks as the 35th largest export economy worldwide, characterised by exploitation and export of raw materials (e.g. copper, fruit, seafood, cellulose, wine). GDP in 2019 was 282billion US dollars (USD) and 25thousands USD per capita (far below the OECD average, ranking 35/37).[4]
Natural environment, land and climate change
Chile, located in the Southwestern end of South America, bordering Peru, Bolivia, and Argentina, is the second-longest country in the world after Brazil, with a north-south distance of 4,329km. The Andes mountain range and the Pacific Ocean act as natural borders. A great variety of landscapes can be found: the north zone has very dry climates (mostly desert), the central zone has temperate climates (and agricultural lands), and the south zone has the coldest and wettest climate. Chile is highly vulnerable to climate change, especially in the central zone, where most of the population lives. This is expected to increase levels of infectious diseases (e.g. malaria, dengue) and also of non-communicable diseases (e.g. hypertension, diabetes) due to impacts on water and food availability and air pollution.
The long and diverse Chilean territory is also reflected in the geographical disparities in health. For example, as described by the Chilean National Health Survey (ENS) 2017, the prevalence of obesity showed a wide range of values, from 24% in Antofagasta (north) to 43% in Aysen (south); the prevalence of diabetes ranged from 8% in O’Higgins (center) to 18% in Atacama (north).[6] I will describe in my results the geographic disparities related to hypertension.
History and legacy, ongoing colonialism, structural racism
Chile became independent from Spain in 1810, and its history with democracy is longer than in many LACcs. However, thousands of people were imprisoned, tortured or killed during the 1973-90 coup of Augusto Pinochet; until democracy was restored in 1990.
Some ongoing effects of colonialism in Chile are the current economy based on natural resources and international trade. However, colonialism built the base for racial and ethnic discrimination and income inequality. The last Census (2017) showed that 13% of the population were from minority ethnic groups (80% of them Mapuches): poverty levels are higher in minority ethnic groups[7] and access to health is unequal, leading to drastic health ethnic inequities in levels of life expectancy, infant mortality and poor mental health.[8]
1.1.2. 2. Conditions of daily life
Quality of life has improved over the last decades, approaching the OECD average for many dimensions, ranging from jobs, income, social connections and work-life balance to health and well-being.[4]
Early life
The under-5 mortality rate per 1,000 live births decreased from 157 in 1960 to 7 in 2017.[9] This impressive decline is linked to the creation of the national health care system in 1952, known as the Servicio Nacional de Salud (SNS). Since then, SNS has challenged malnutrition with a free distribution of powdered milk and breastfeeding promotion. Other important SNS interventions were the implementation of oral rehydration for diarrhoea cases; increasing the proportion of deliveries with professional care and early vaccination strategies.[10] Unfortunately, evidence suggests that the infant mortality decline has stagnated in recent years and some authors hypothesise that this could be related to increasing inequities by SEP in the distribution of mortality burden.[11] Currently, Chile has high levels of child poverty (ranking 3/37 of OECD countries) and one of the highest infant mortality rates among OECD countries (ranking 4/37 of OECD countries).[4] Obesity levels among children aged 6-7 years have doubled in absolute terms in the last 10 years, from 12% in 1993 to 24% in 2017,[12, 13] representing one of the highest levels in the OECD.[4]
Education
Levels of educational attainment have improved considerably in the last decade. The proportion of the population with tertiary education increased from 17% to 25% between 2009 and 2017. However, it remains below the OECD average (see Figure A1.1 Appendix A1).[4]
The proportion of the population aged 5-14 years enrolled in school in 2016 was high (98%), exceeding that in other LACcs (e.g. Colombia 87%, Costa Rica 93%), and similar to most OECD countries.[4] However, schooling is socially segregated, in favour of privately managed schools, with levels of private schooling being higher than the OECD average. Access to tertiary education has been steadily increasing since 1990 across all income groups. However, the gap in levels of access to tertiary education between the richest and the poorest income quintiles remains large (Figure 1. 3). The gap of attainment of at least one year in the tertiary education between the poorest and richest quintiles increased in absolute terms from 49% in 2006 to 55% in 2017 (see Table A1.1 Appendix A1). [4, 7]
Figure 1. 3: Access to tertiary education according to income quintiles. Chile, 1990-2013
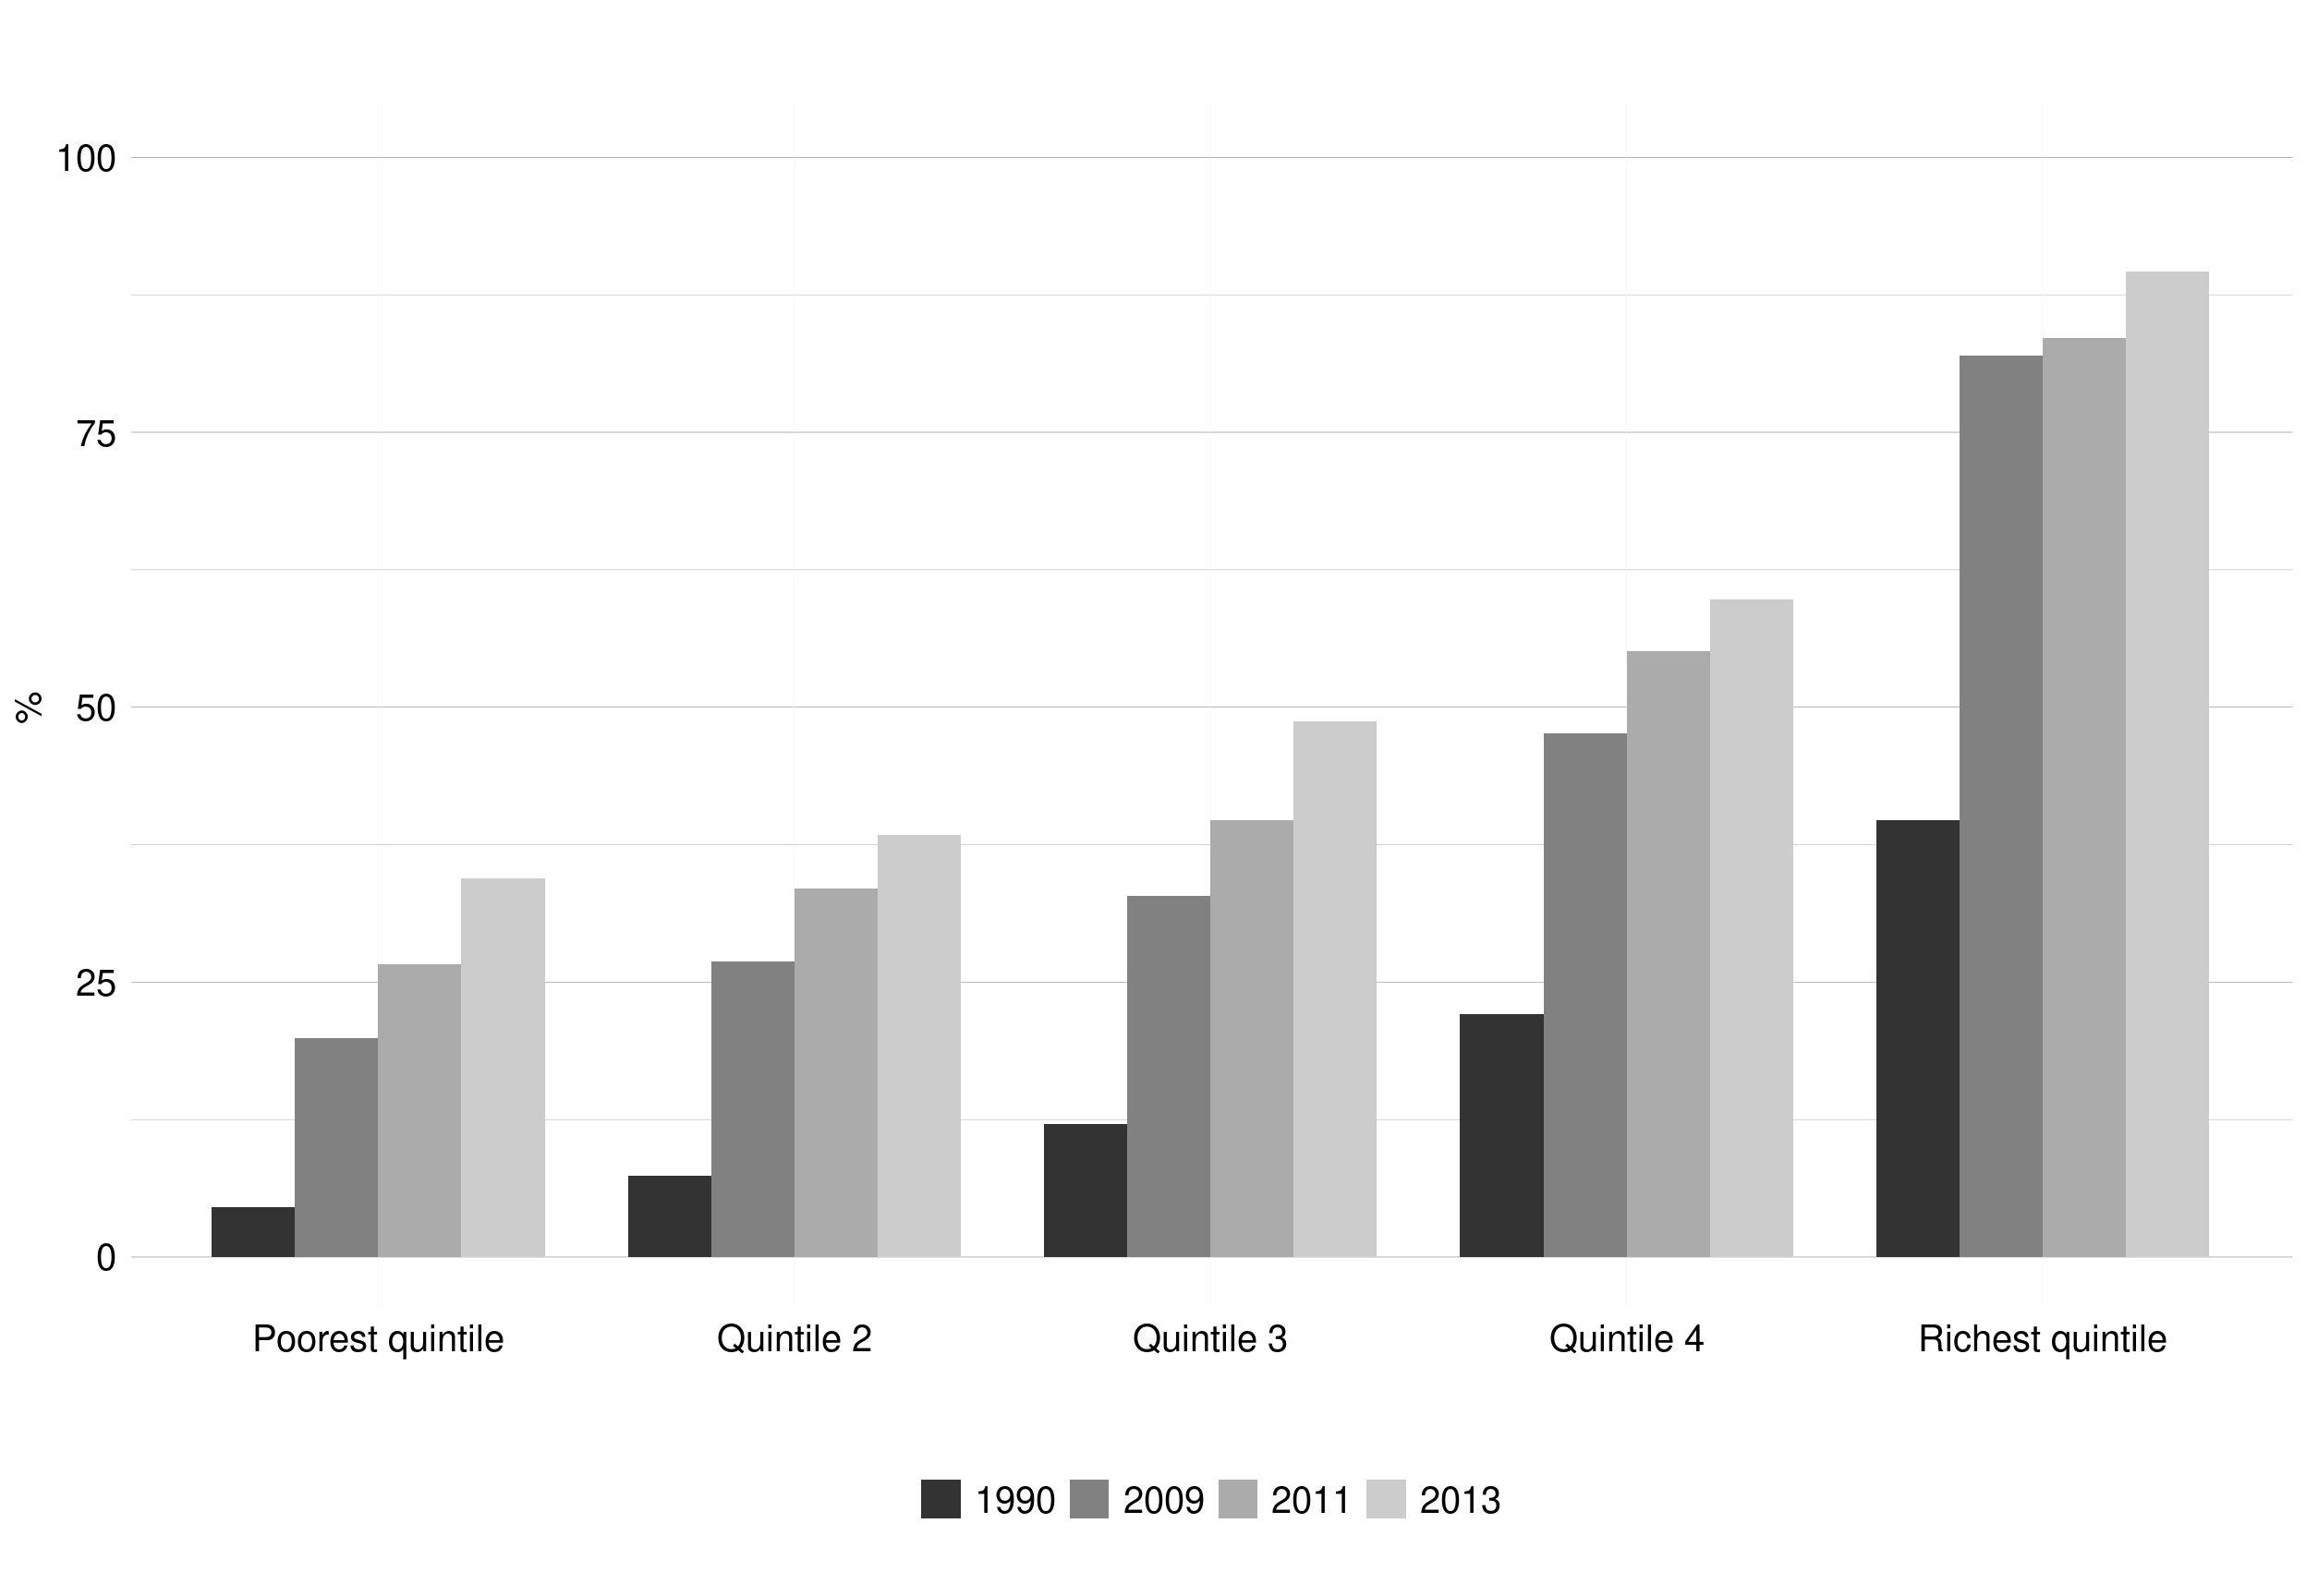
Source: OECD (2015).[4]
Working life
The employment rate was 63% in 2017 and was higher among males (72% males; 53% females).[4] This gender difference decreased in absolute terms between 2005-2017 (from 32% to 19%, see Figure A1.2 Appendix A1). The employment rate varies by geographical location and income, with the poorest group having the lowest employment rate (34%) compared with the richest (77%).[7]
Older people
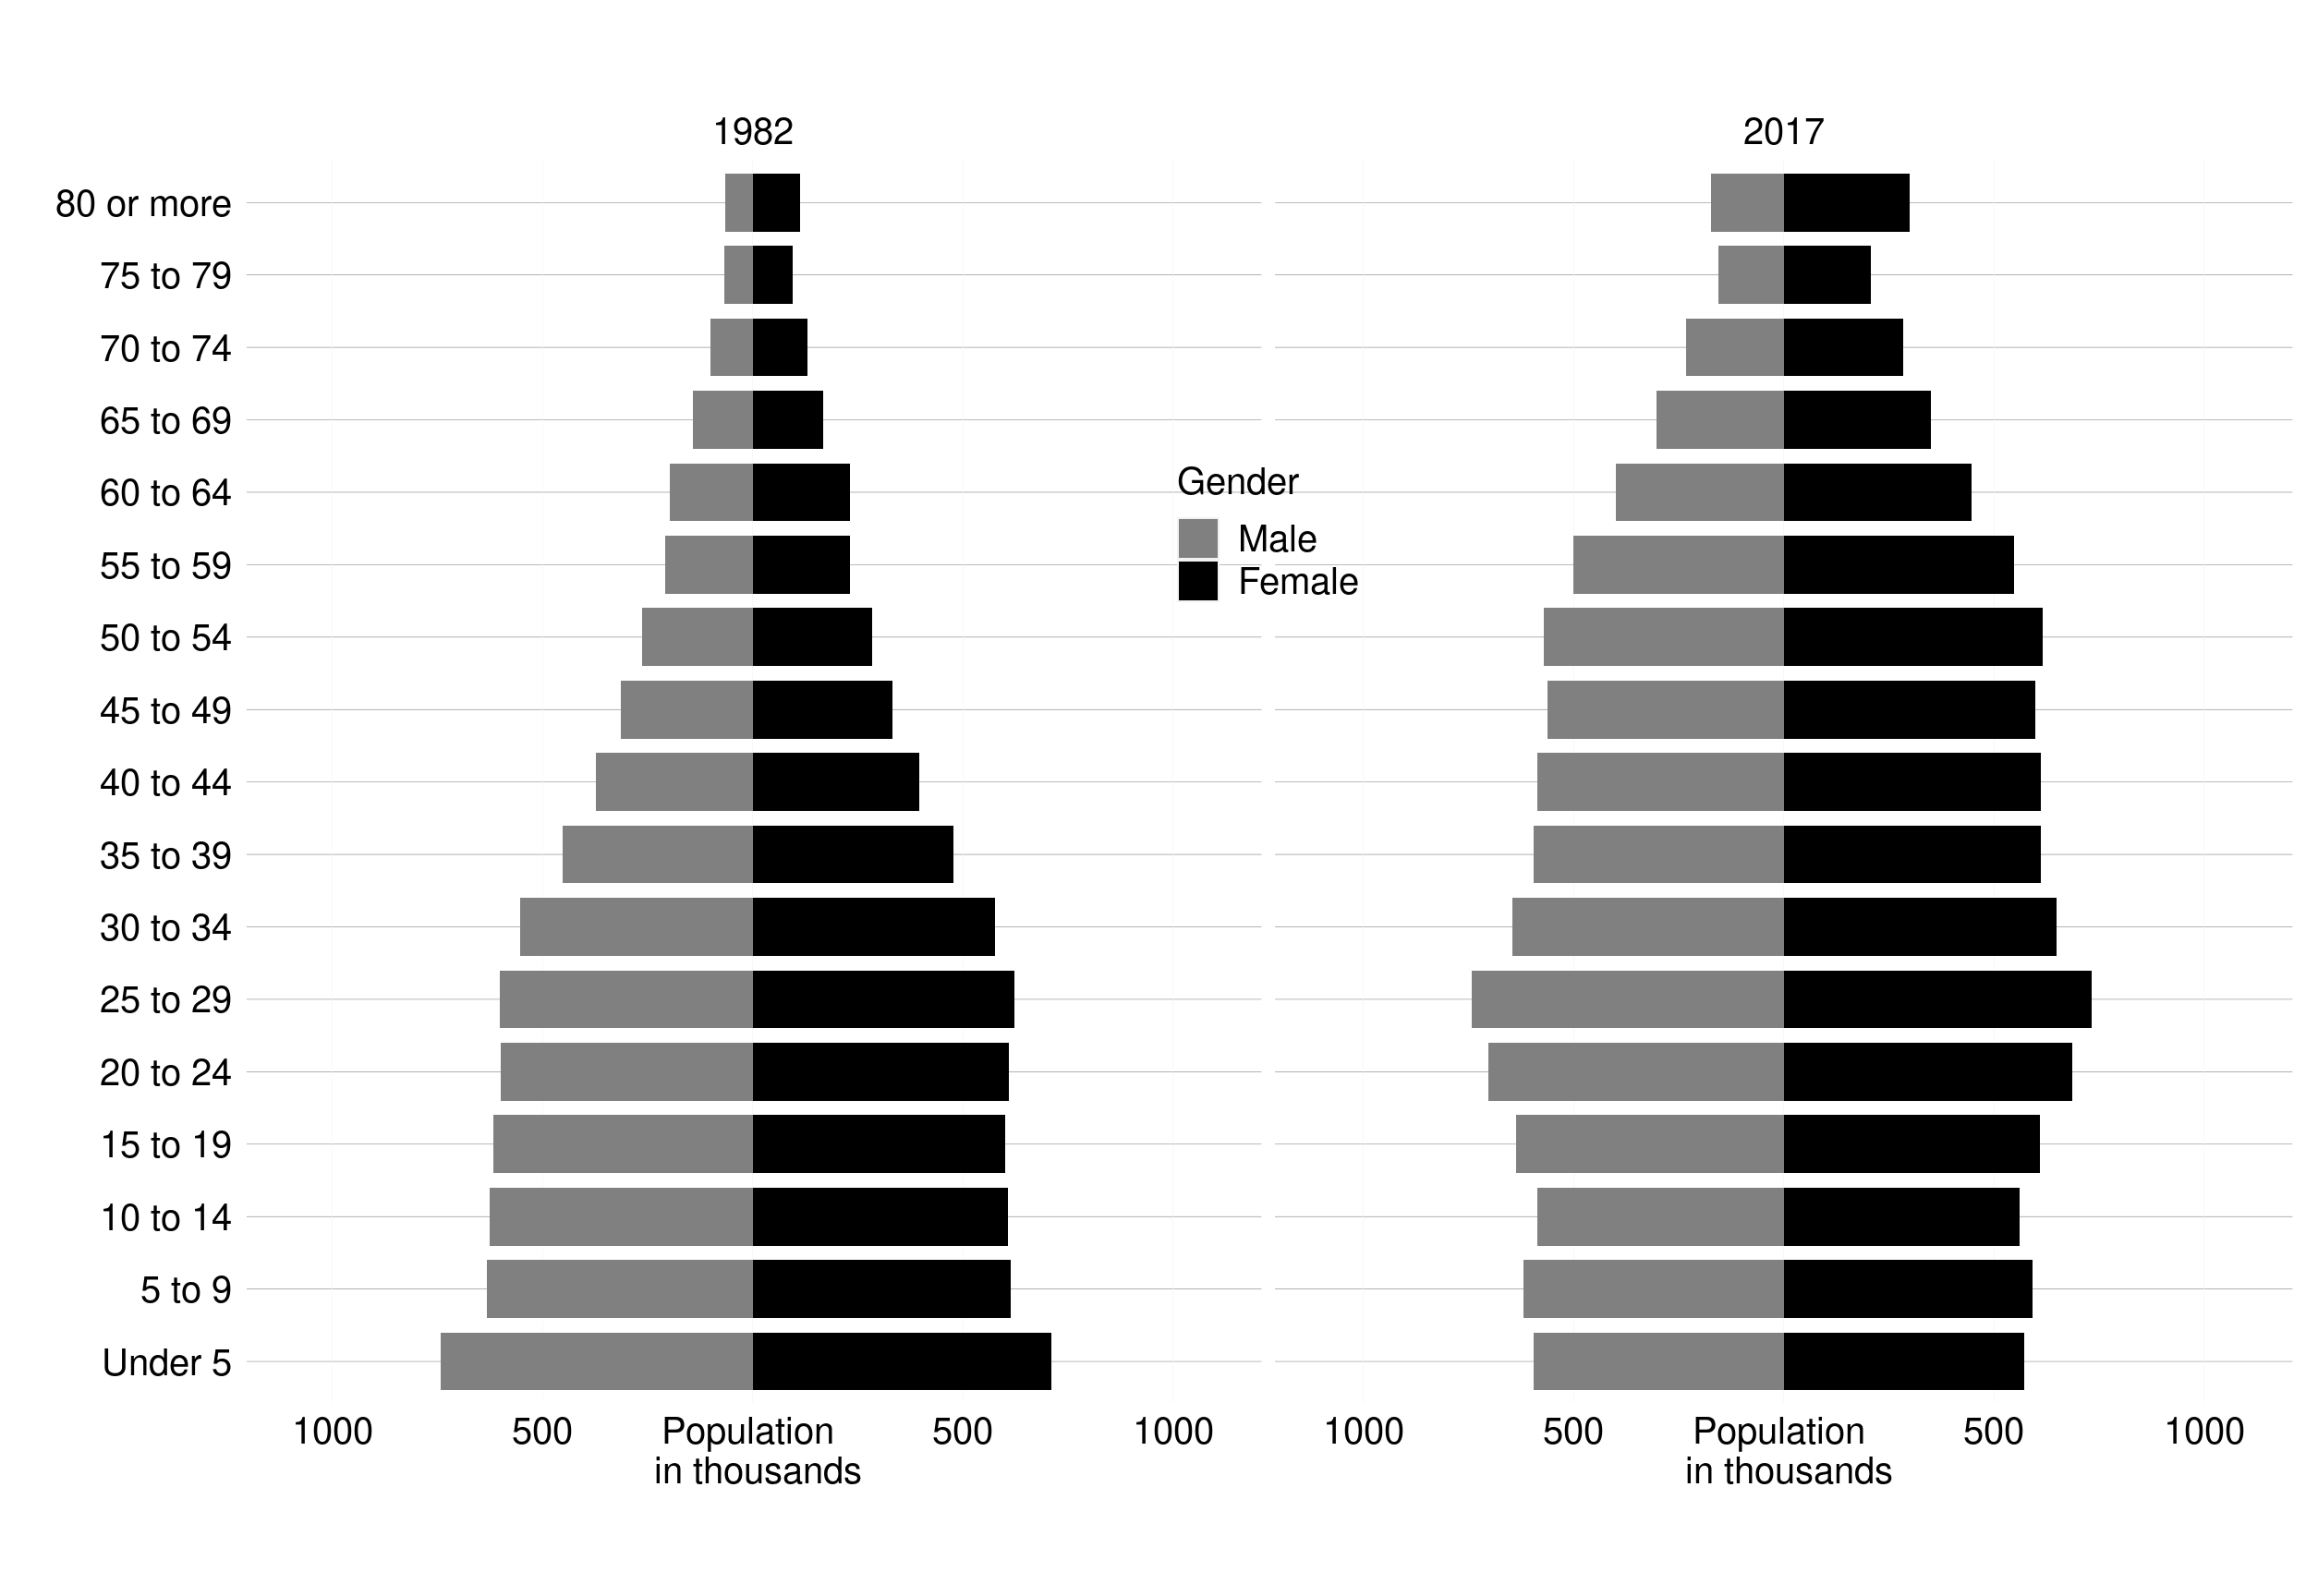
Chile has reached an advanced stage of the demographic transition (i.e. the transformation of a society from a traditional to a highly modernised state), due to the low levels of fertility and premature mortality achieved, resulting in the ageing of the population (Figure 1. 4).[4]
Figure 1. 4: Population pyramids. Chile, 1982-2017
Overall, self-reported quality of life among people aged ≥60 years has increased over time (2007 to 2016), especially in the subindex of affective relationships.[14] However, people of this age also reports low levels of material conditions.[14] The legal retirement age is 60 and 65 for men and women, respectively. However, 40% of men and 25% of women aged ≥60 years are still working (especially as self-employed), with higher levels of employment among the better educated.[14] One-fifth of persons aged ≥60 years have never contributed to the Chilean pension system, with this proportion being higher among women and those with a basic educational level.[14] On average, pensions are low in value, and 23% of persons aged ≥60 years describe it as not being enough to meet their needs.[14] Evidence shows that improving the pension system is essential to address income inequality.[4]
Income and social protection
The percentage of Chileans living in poverty was 29% in 2006, decreasing to 9% in 2017 (Figure 1. 5).[7] Extreme poverty decreased in a more pronounced way, from 13% to 4%.
Figure 1. 5: Levels of extreme and non-extreme income poverty (%). Chile, 2006-2017
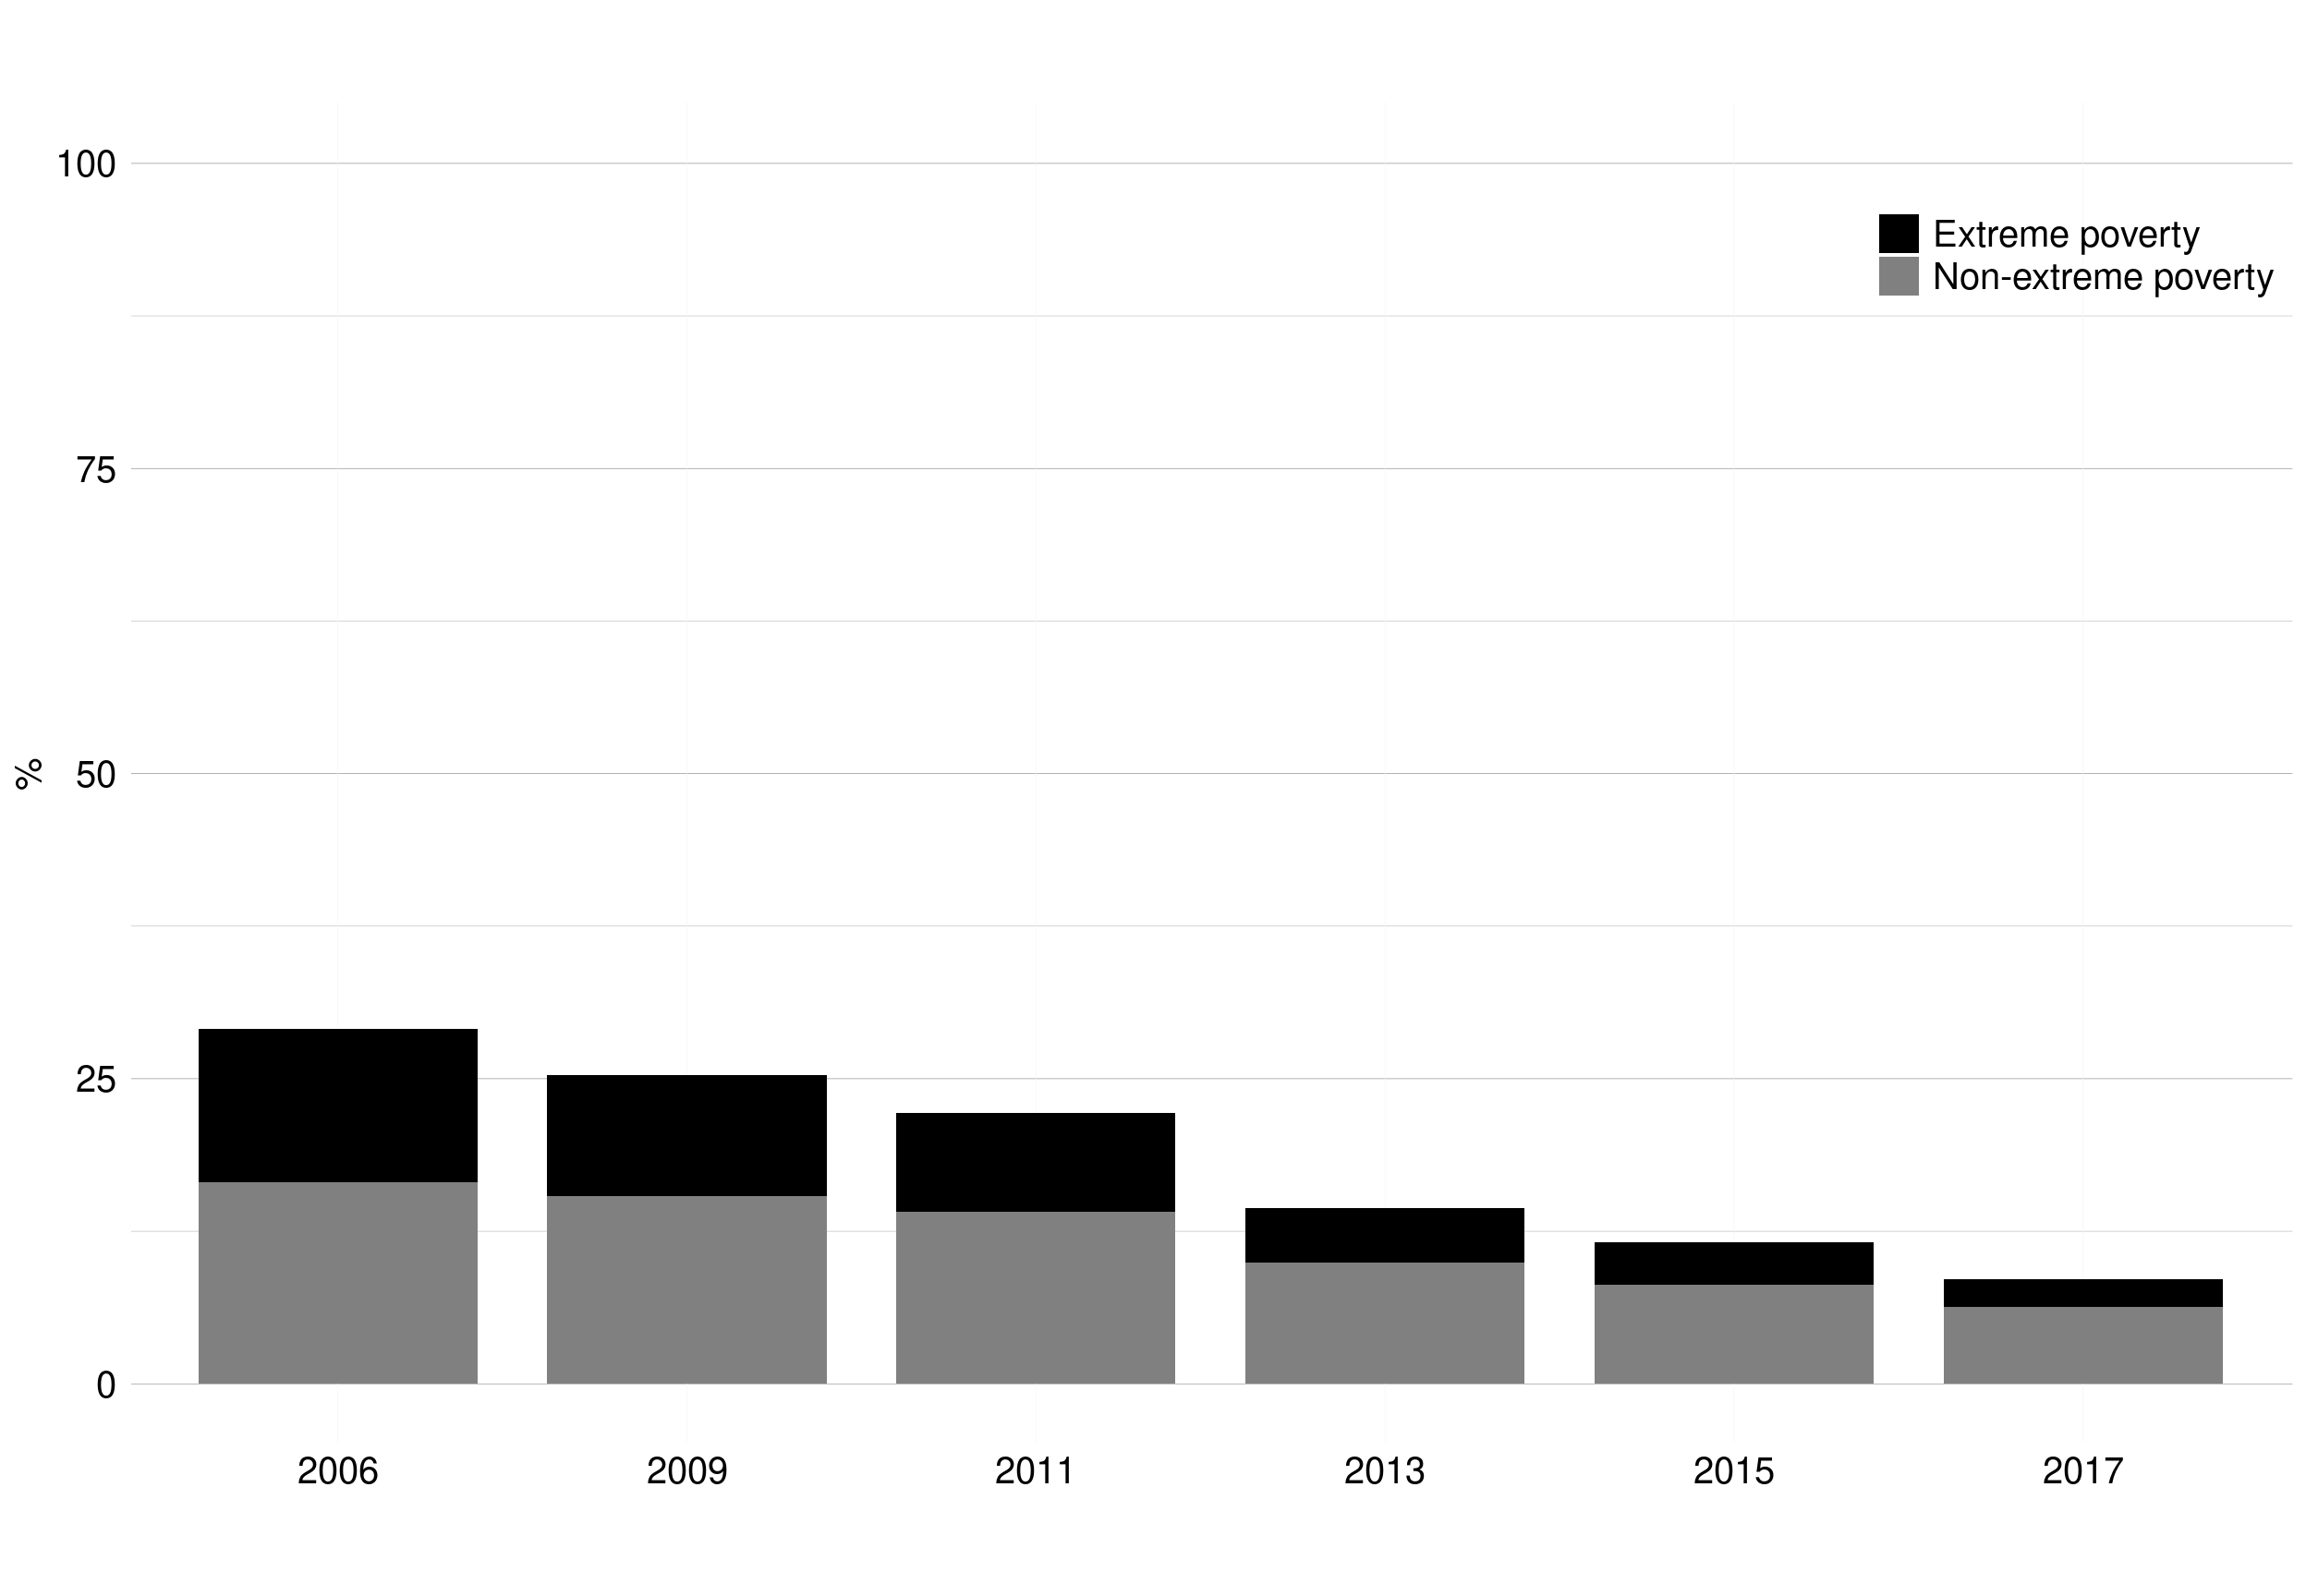 Income poverty defined in Table A1.2 Appendix A1.
Government subsidies, as a percentage of the total income, almost doubled since 2006 from 1.5% to 3.3% in 2017. Subsidies are much higher among those with the lowest income, reaching 45% in the poorest decile and 15% in the second decile, decreasing to 0.2% for those in the richest decile.[7]
Levels of income and wealth inequality
The Gini coefficient is a summary measure of the degree of inequality in income and wealth distributions; varying from 0 (perfect equidistribution/equality) to 1 (perfect inequality, i.e. all income being held by one person). In 2017, among OECD countries, Chile had the third-highest Gini (just below Colombia and Mexico). Inequality levels in Chile between 1987 and 2017 were similar to the average for all LACcs (Figure A1. 3 Appendix A1 and Figure 1. 6). Although Chile is becoming more equal (the Gini decreased from 0.56 in 1987 to 0.44 in 2017), it remains well above the OECD average (Figure A1. 4 Appendix A1).[3]
Figure 1. 6: World map of the Gini coefficient of disposable income inequality (last reported value)
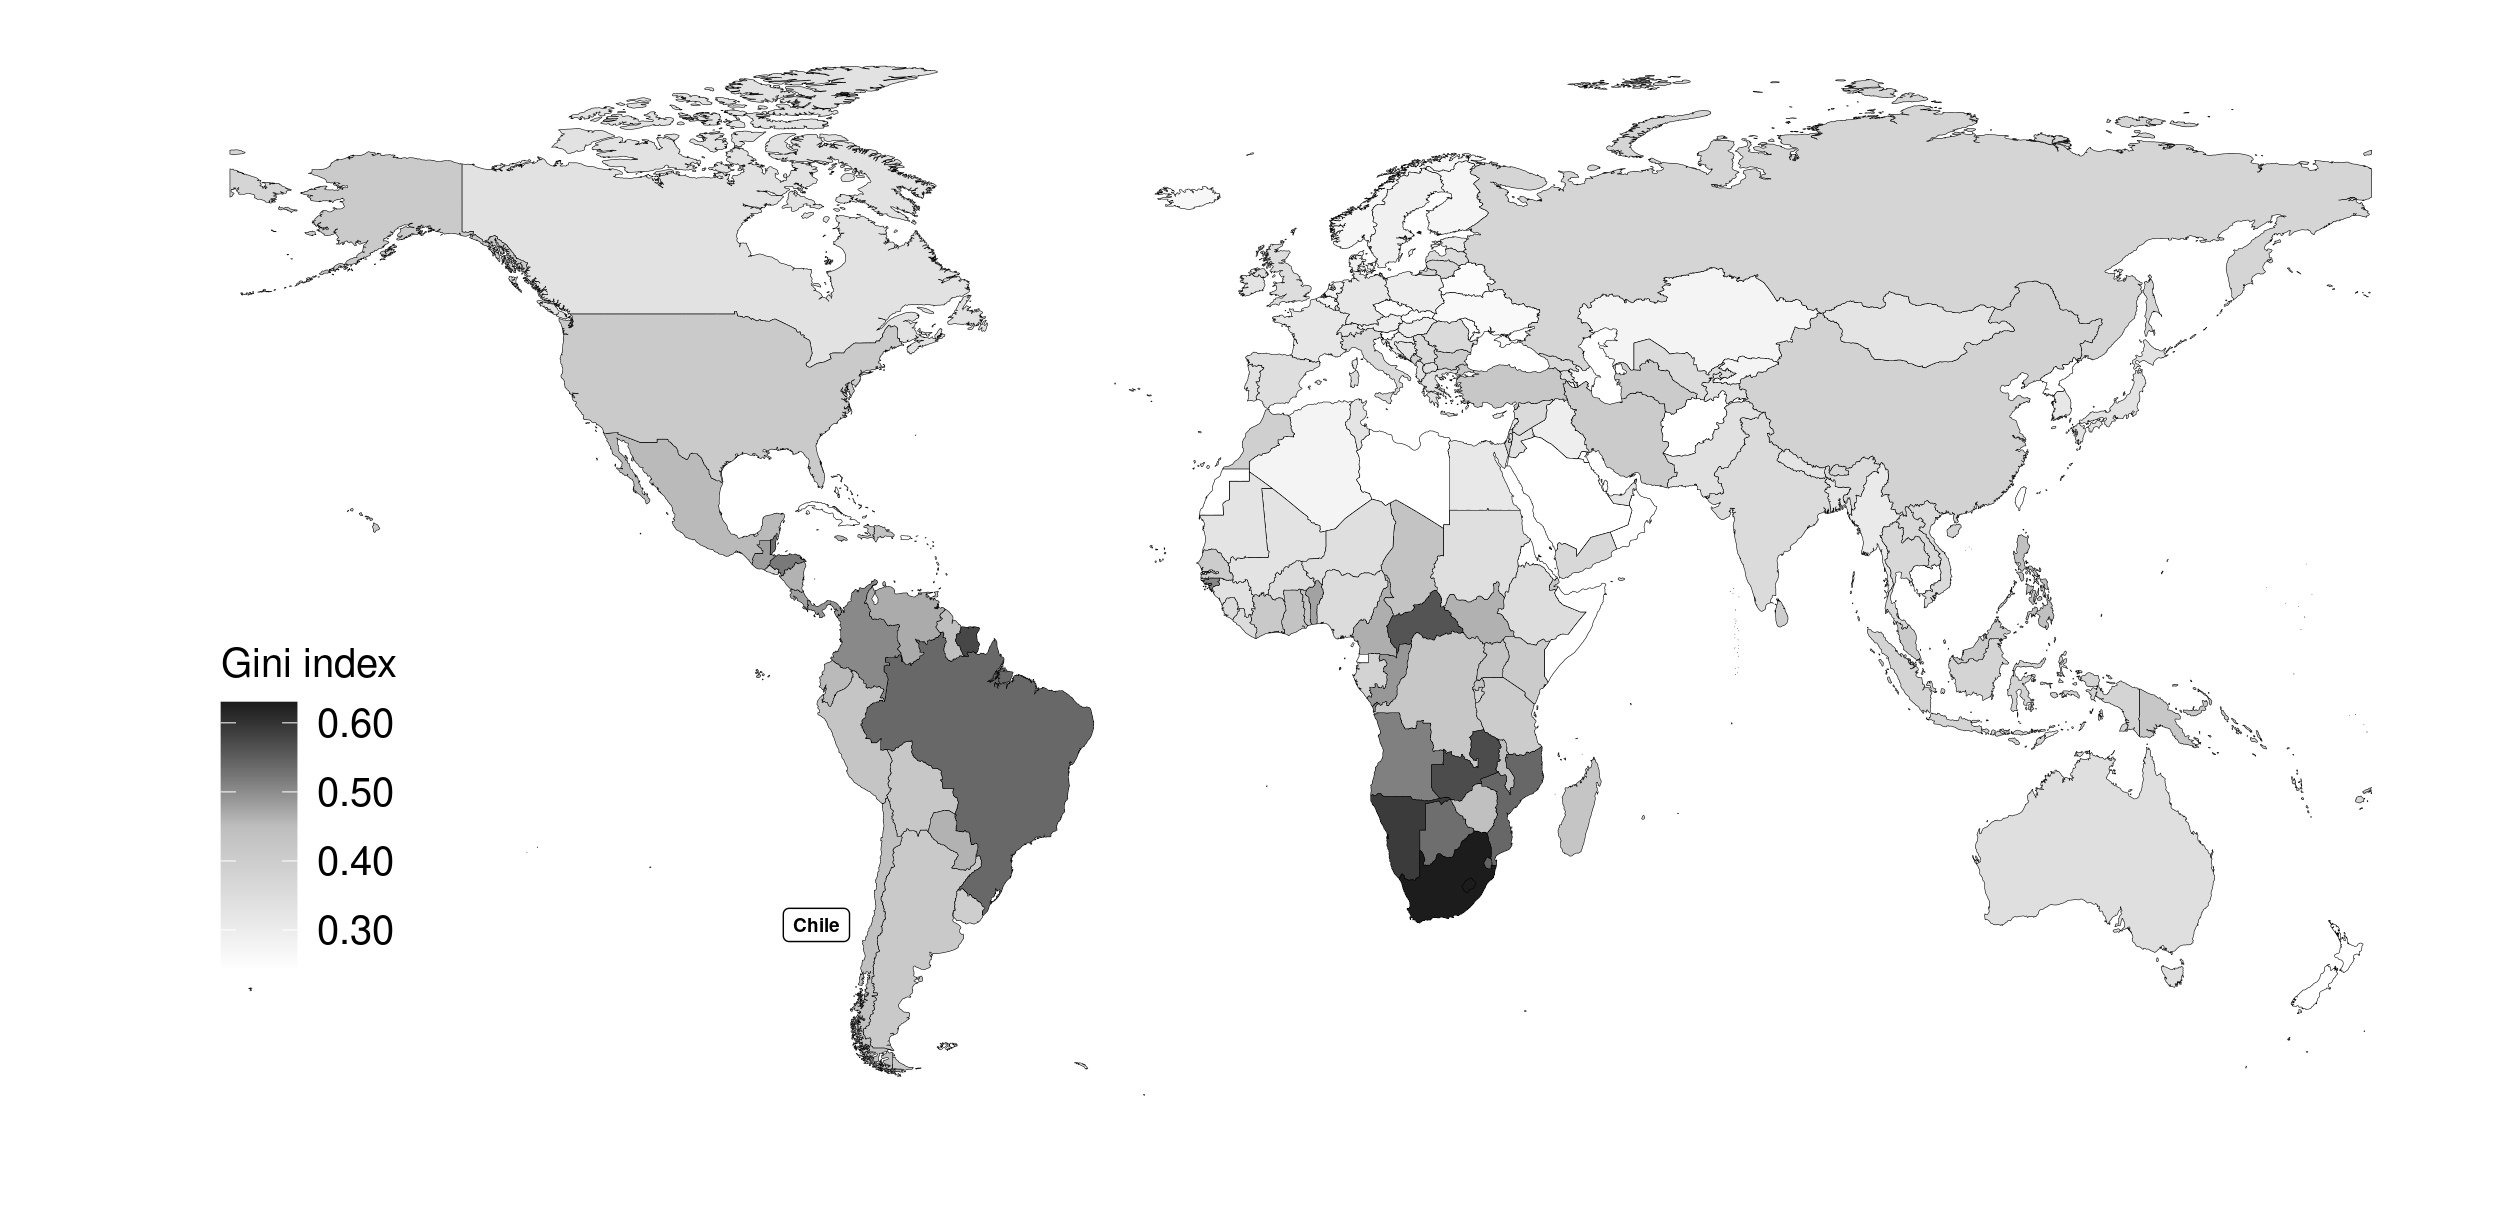 Last Gini index reported by country. Data ranging from 1992 to 2018. Chile last value from 2017.
Source: World Bank [4]
Last Gini index reported by country. Data ranging from 1992 to 2018. Chile last value from 2017.
Source: World Bank [4]
Violence and personal safety
When compared to other OECD countries, Chile performs poorly regarding violence and personal security.[15] The homicide rate is the highest in the OECD, and only 51% of the population report feeling safe walking alone at night.[15] Nevertheless, compared to the other LACcs, Chile has one of the lowest homicide levels and has the lowest proportion of the population who reported limiting recreation due to insecurity or reported being a victim of crime in the previous 12 months.[15]
Environment and housing
Indicators of housing affordability, number of rooms/person, and access to sanitation facilities have improved in the last 20 years, reaching similar levels to the OECD average in 2015.[4] However, only 69% of the population were satisfied with the water quality in their area in 2016 (one of the lowest proportions in the OECD) and the level of air quality in Chile was below the OECD average in 2017.[4]
Health system
The Chilean Healthcare system is composed of two main subsystems, public and private, both for insurance and the provision of health services. The public subsystem, FONASA, and the private subsystem, ISAPRE, in 2017 covered around 74% and 19% of the population, respectively (Figure 1. 7).[16] Specific groups such as the Armed Forces and Police, or specific groups of workers have separate healthcare systems.[16]
Figure 1. 7: Type of health insurance by year. Chile, 1990-2018
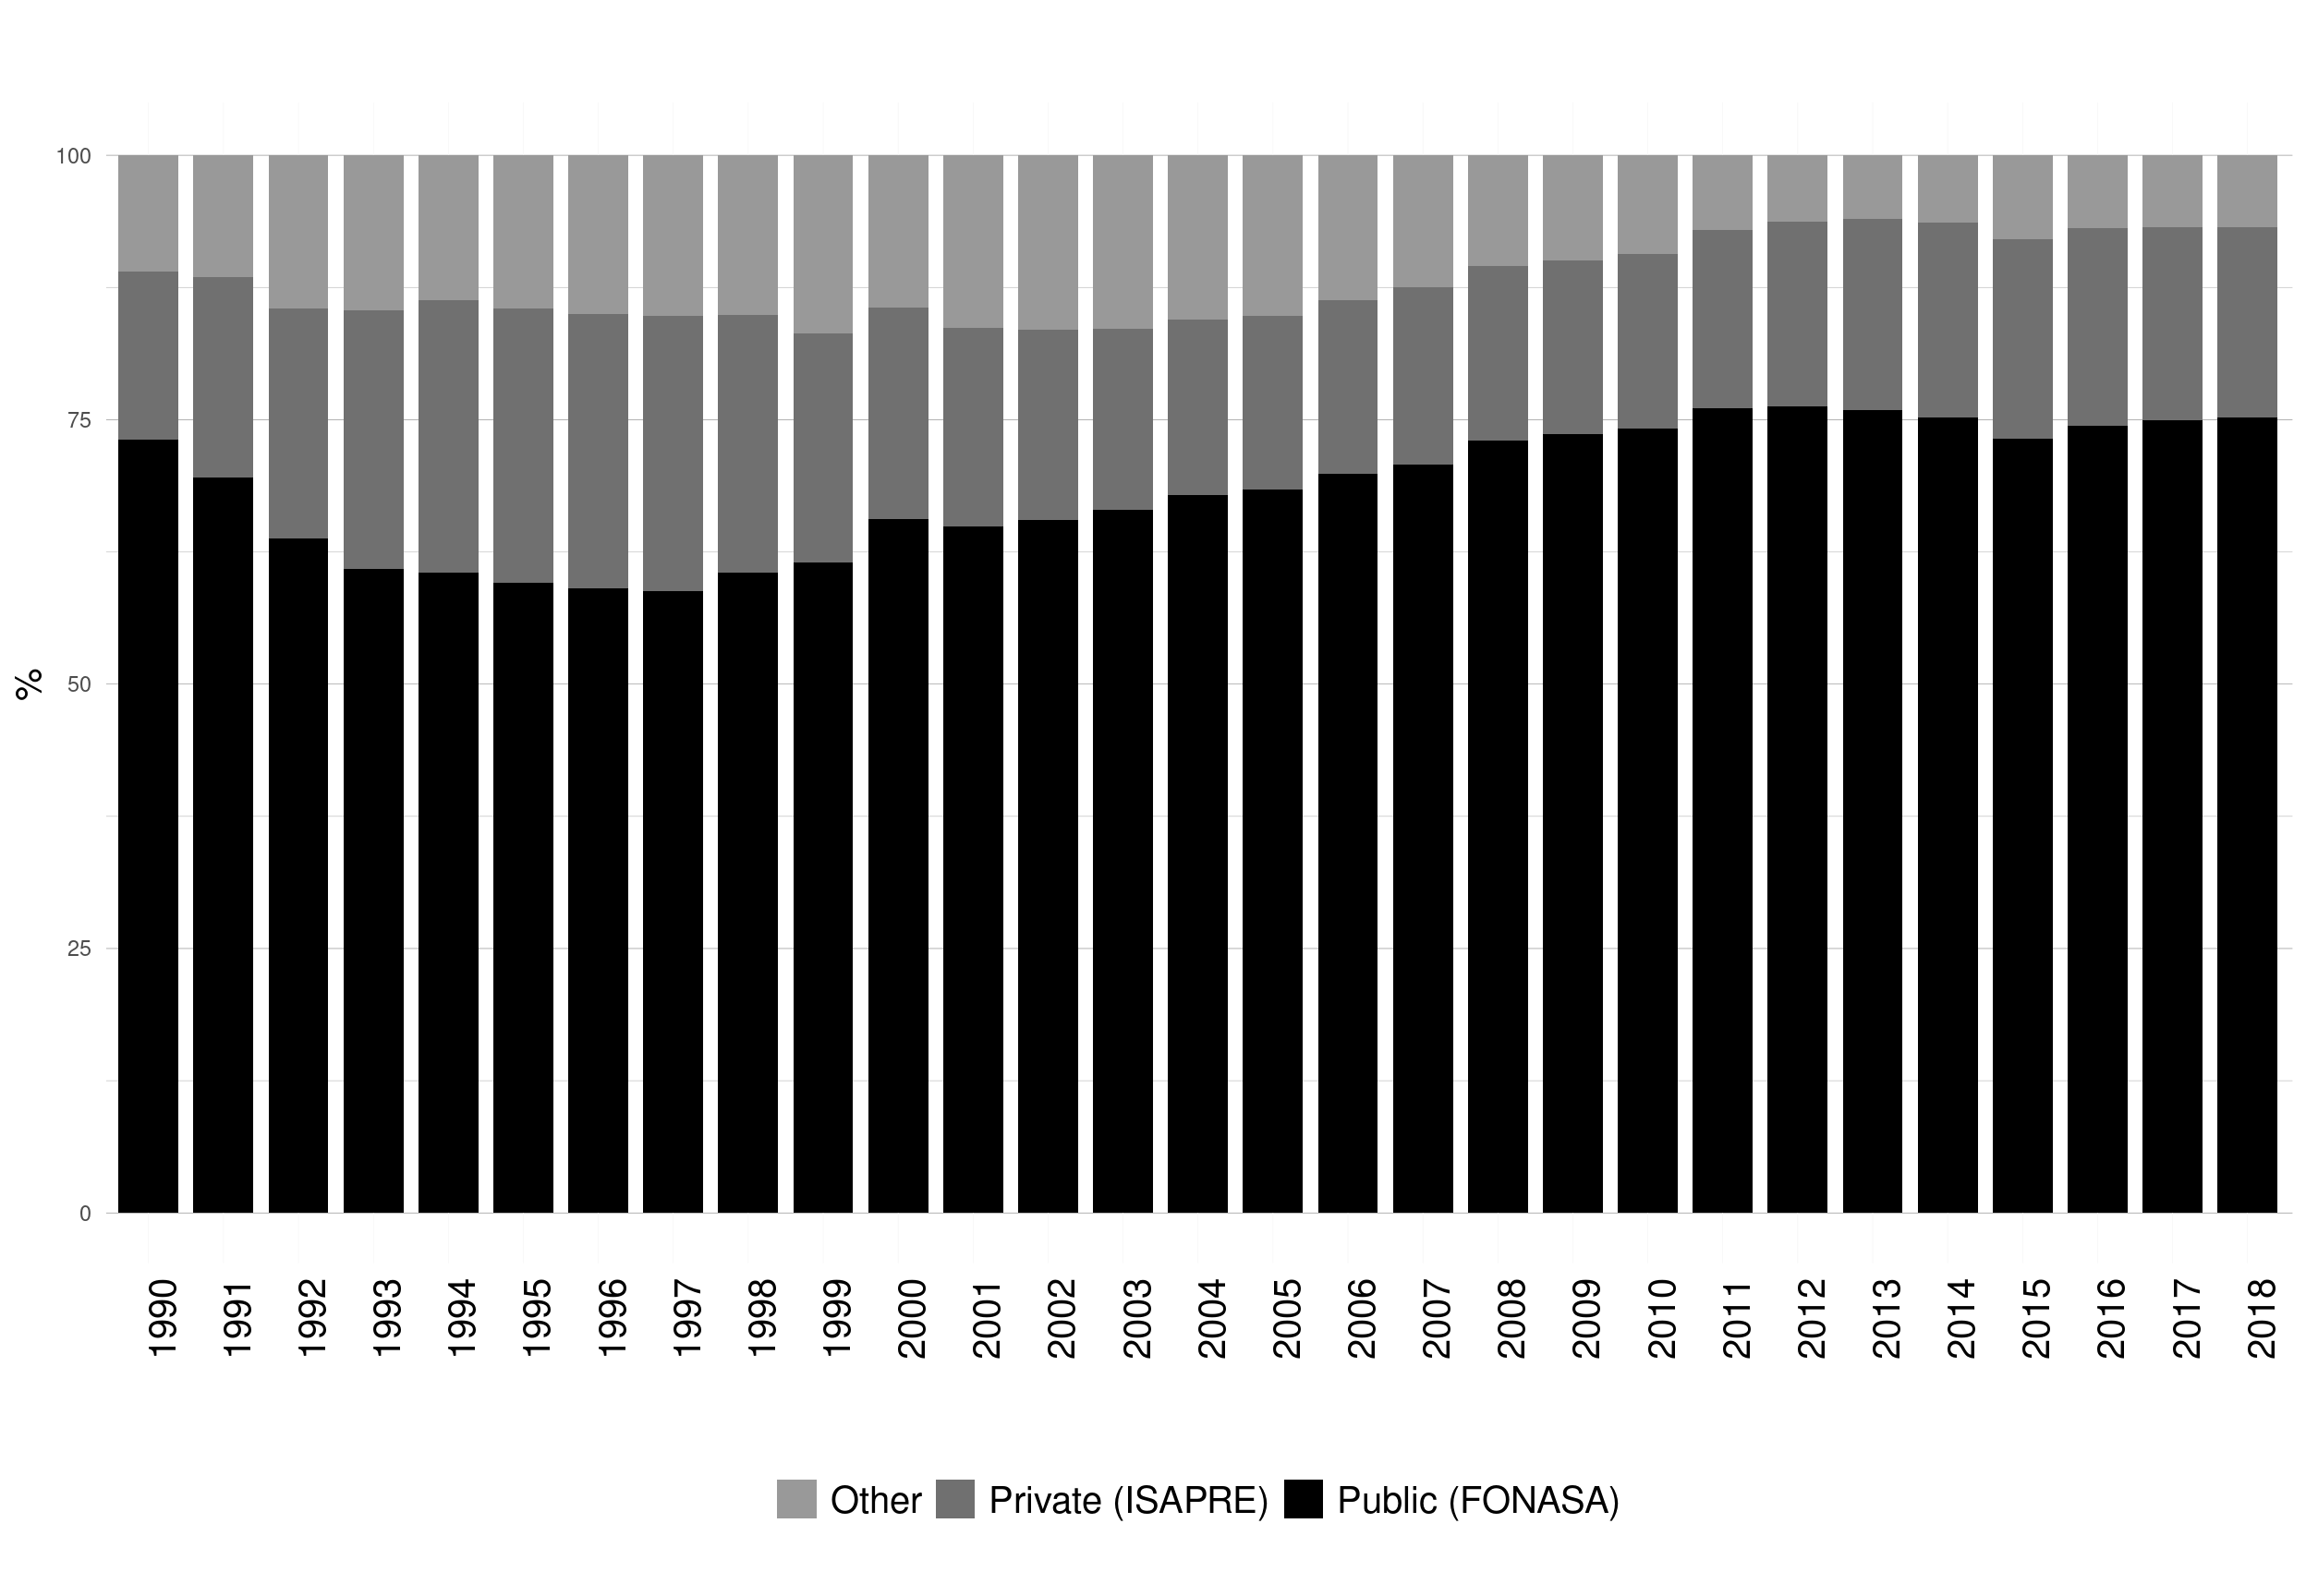
Source: MINSAL (2016).[16]
Registration in the private healthcare system is unequally distributed by income, being considerably higher in the richest income decile (Figure 1. 8).[17]
Figure 1. 8: Type of health insurance by income decile. Chile, 2017
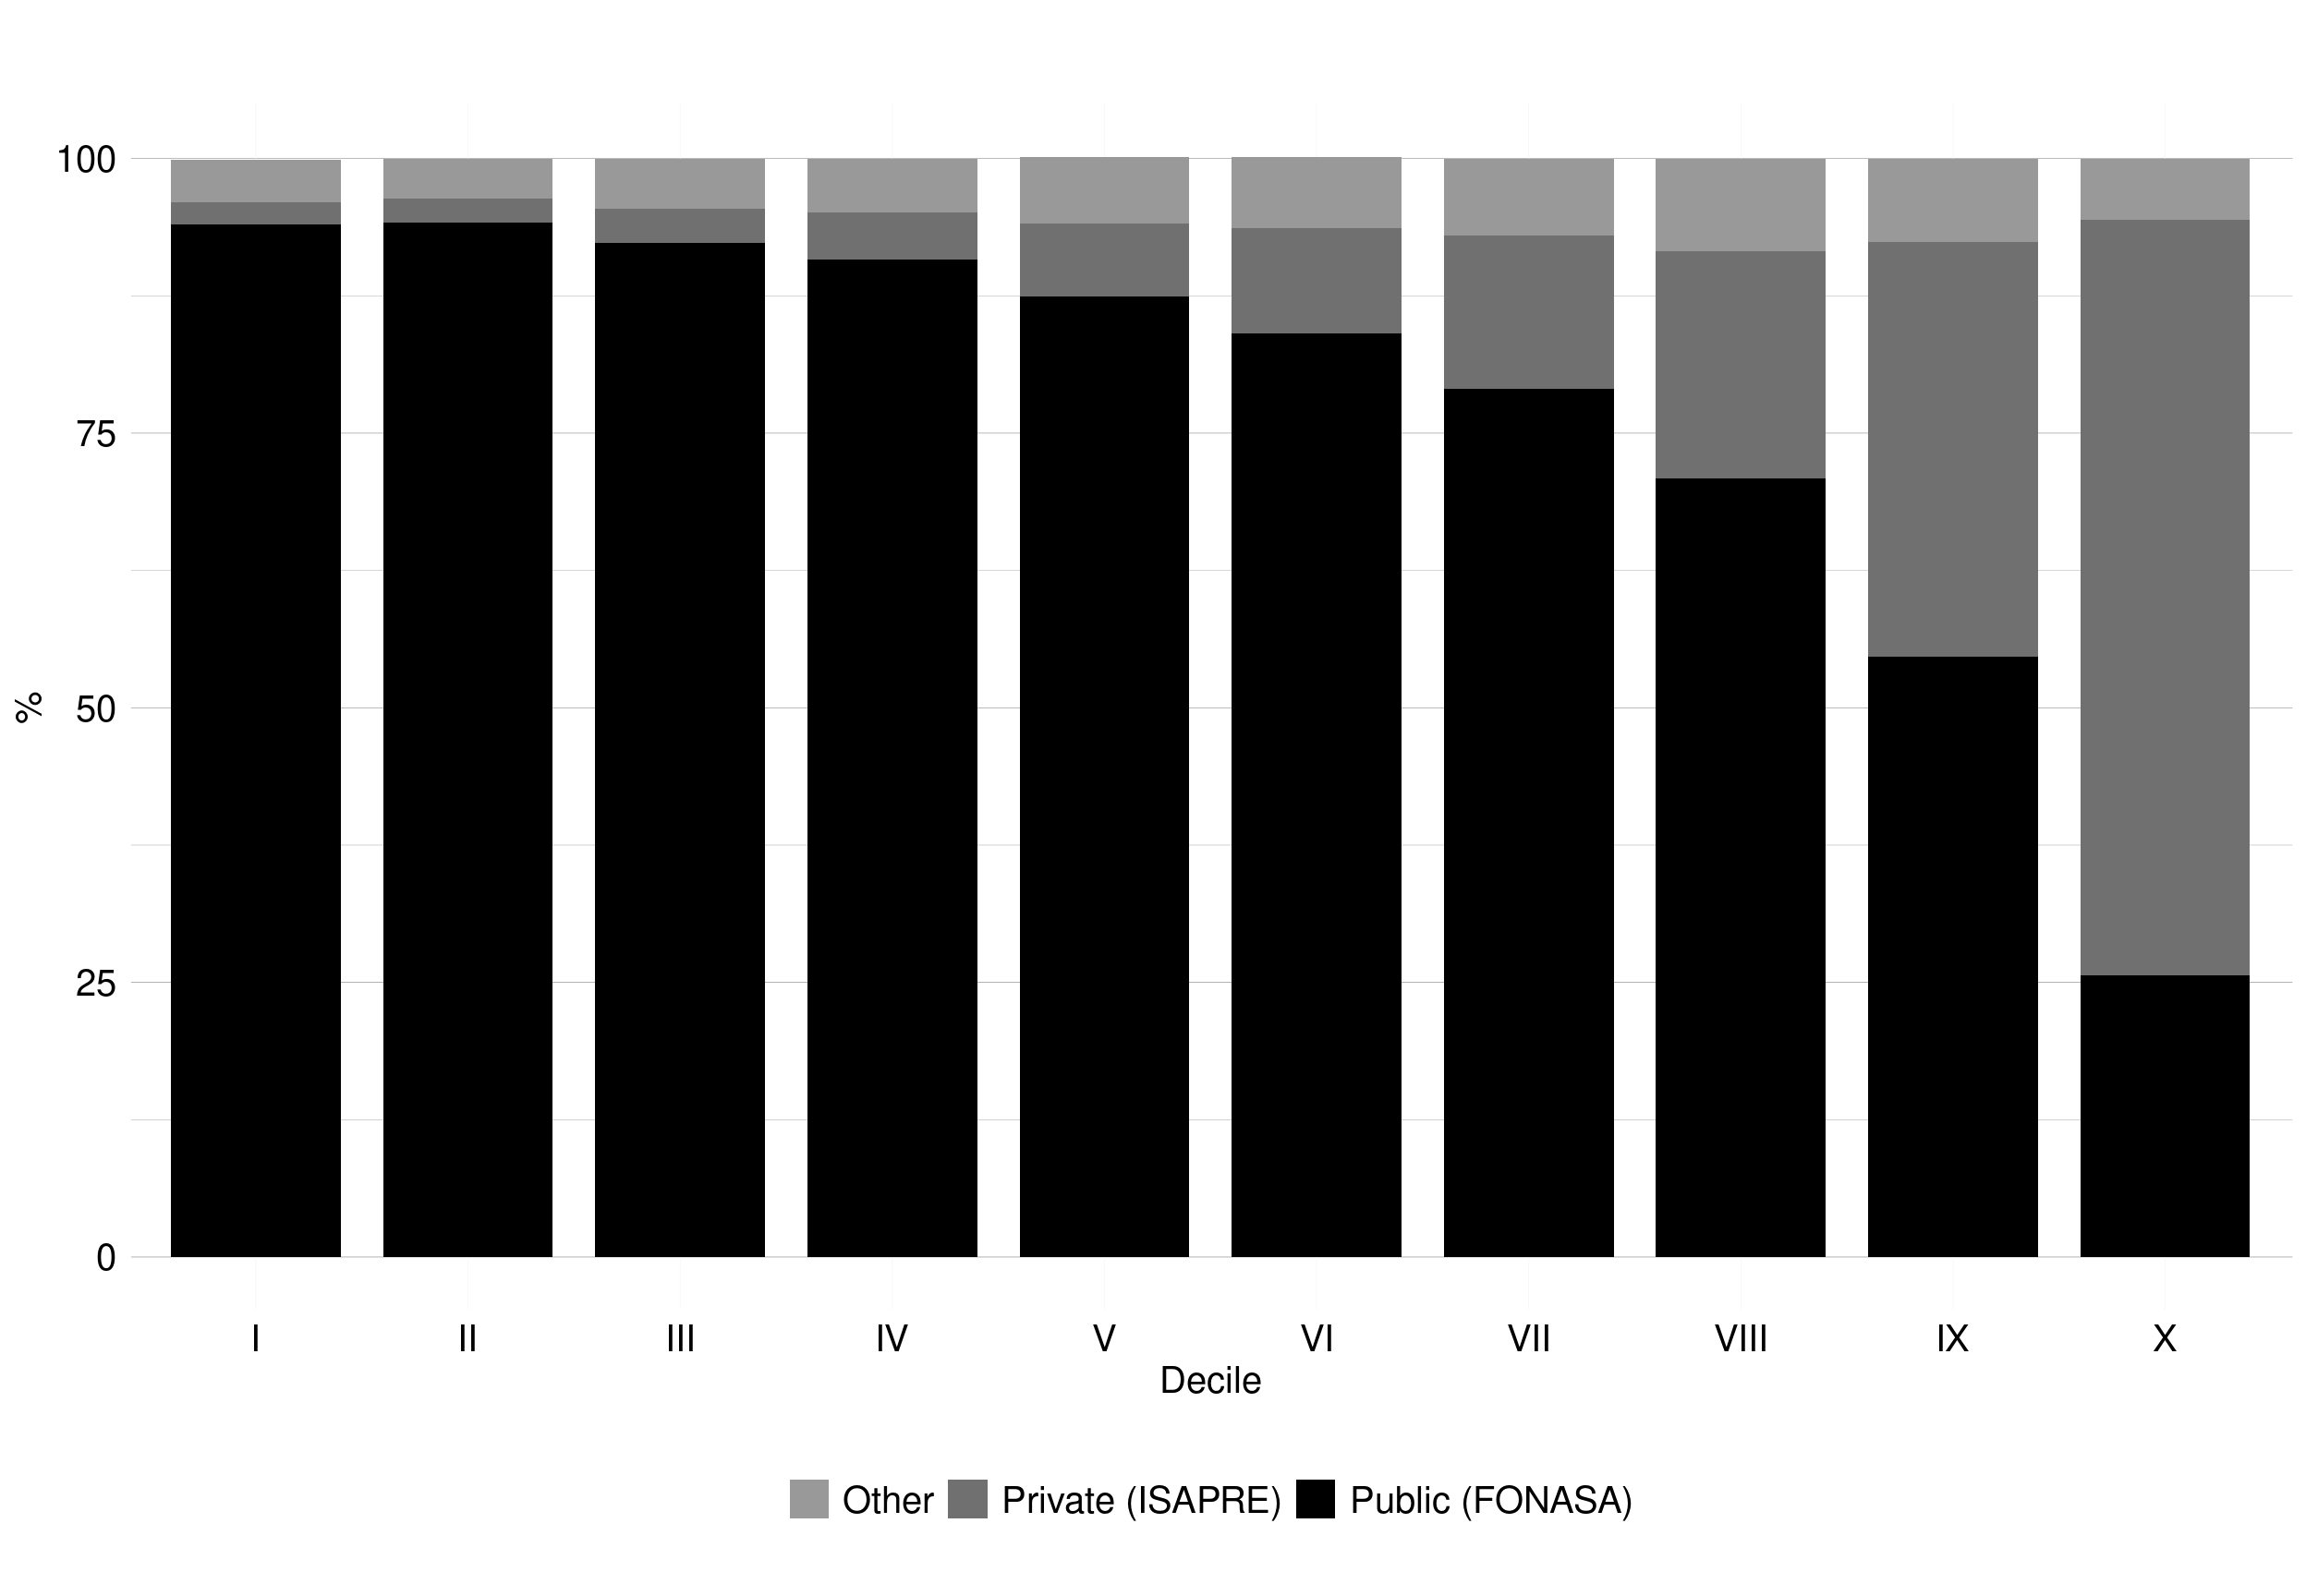
Source: CASEN (2017).[17]
There are 80 health conditions of high burden, severity or mortality cost (e.g. hypertension, myocardial infarction and diabetes) on which the estate provide explicit guarantees to ISAPRE’s or FONASA’s registrants.[18] These guarantees began in 2005 with the AUGE programme (‘Acceso Universal con Garantías Explícitas,’ translated as Universal Access with Explicit Guarantees), later named as GES (‘Garantías explícitas en Salud,’ translated as Explicit Health Guarantees). The GES programme guarantees:
- Access to health services
- Maximum waiting times (both for diagnosis confirmation and treatment initiation)
- Financial protection (the state subsidises 80-100% of the treatment costs)
- Quality of care (accredited health care services).
Epidemiology
Between 1960 and 2018, mortality rates for persons aged 15-60 years decreased from 232 to 59 per 1,000 among females, and from 332 to 108 per 1,000 among males (see Figure A1.5 Appendix A1).[3] Life expectancy at birth increased over the same period by 23 years (from 57 to 80), an increase that was greater than the average increase across LACcs (see Figure A1.6 Appendix A1).[3] Although the reduction of childhood mortality mentioned above mainly explains the increase in life expectancy at birth, it is also due to the increase in longevity.
Although people are living longer, life at middle- and older-ages is affected by chronic diseases. As shown in analyses of the Chilean National Health Surveys (ENS) in 2003 (ENS2003), 2009-2010 (ENS2010) and 2016-2017 (ENS2017) for the population aged ≥17 years, there is both a high and increasing prevalence of CVD and their risk factors such as obesity, elevated low-density lipoproteins (LDL) cholesterol, and sedentarism.[19–21] The peak of the chronic disease burden is yet to come.
As in many other countries, the leading causes of death have changed in Chile during the last 50 years, with a considerable increase in mortality from diseases of the circulatory system and tumours and a decrease in mortality from infection and perinatal diseases (see Figure A1.7 Appendix A1).[22] As described in the next chapter of my PhD, a high proportion of deaths from diseases of the circulatory system are related to hypertension, one of the most prevalent health conditions both in Chile and worldwide.
1.1.2. 3. Taking action
Human rights
The international convention on the elimination of all forms of racial discrimination was Ratified by the State of Chile in 1971. Since then several international covenants were subscribed in Chile, including the Geneva Conventions, the Declaration of the Rights of the Child and the Universal Declaration of Human Rights.
However, Chileans were victims of violations of our human rights during the 1973-90 coup of Augusto Pinochet, where massive human rights violations took place committed by the armed and law enforcement institutions against indigenous, student union and trade union, as well as against the civilian population during the process of transition to democracy. Despite the improvement in Human rights since 1990, massive student mobilizations happened in 2006 and 2011, while massive mobilizations of women around March 8 and huge protests about the pension system were happening in recent years. The mobilizations became stronger during 2018 when a social and political crisis has developed in the country, gestated in decades of lack of response of social demands from the political system. In the context of this crisis, serious human rights violations has occurred. [23]
The “right to the highest attainable standard of health” is one of the main concern to the Chilean state since the 90’. Despite a steady improvement in several health indicators, the Chilean health system, designed and implemented during the military regime, is critised to be involved in many of the health inequalities we face in the country. Long waiting lists in the public system and discrimination by gender, age and pre-existence of health conditions in the private system are examples of the problems experienced by the Chilean population. The health-care reform in 2005 was one of the main steps made by the Chilean state to address the epidemiological transition of the population, improve the quality of care and reduce the gap between the private and public system. Details about the health care reform are described below in the “Health system” section.
1. 2. Hypertension in Chile: prevalence, care cascade, risk factors, policies and guidelines
This section first describes hypertension prevalence, and aspects of its care cascade, which includes the indicators of awareness, treatment and control in both Chile and worldwide. Secondly, it describes the main risk factors associated with hypertension. Thirdly, it discusses the variations across groups (e.g. gender and SEP) in levels of hypertension care cascade It then outlines the Chilean policies and guidelines for hypertension.
1.2. 1. Hypertension: prevalence and care cascade levels
Hypertension (high blood pressure) continues to be one of the most important health challenges, being a major risk factor for cardiovascular morbidity and mortality worldwide. Hypertension is associated with coronary disease and cardiovascular events[24] and is the major risk factor for heart failure,[25] stroke[26] and kidney disease.[27] Low and middle-income countries (LMICs) are showing the sharpest increase in the prevalence of hypertension globally during the last four decades [28], explained only partially by population ageing. LMICs also show lower levels of attainment at each step of the hypertension care cascade (e.g. awareness, treatment and control), compared with high-income countries (HICs) [29]. High blood pressure (BP) is a risk factor for cardiovascular disease (CVD). In Chile, CVDs are the main cause of death, explaining 26-27% of the overall mortality every year between 2000 and 2017 [30].
As seen in Figure 1. 6, the economic prosperity in Chile has not been shared equally across all segments of the population, creating a unique profile for hypertension prevalence and its care cascade (i.e. the proportion of persons with hypertension at various stages of the management continuum that starts with screening and ends with control).
Hypertension prevalence
Estimating the global prevalence of hypertension is difficult. One common operational definition of hypertension is high blood pressure or the current use of antihypertensive medication.[29, 31] Even using this operational definition, it is possible to have considerable heterogeneity across different studies due to different methods of data collection (e.g. number of BP measurements and measurement devices) or different thresholds (e.g. BP≥140/90mmHg or BP≥130/80mmHg). For the sake of brevity, detailed information on the sources of heterogeneity for estimating hypertension prevalence is provided in Table A1.3 Appendix A1.
While hypertension prevalence (defined as BP≥140/90mmHg or use of an antihypertensive treatment) across 90 countries remained stable between 2000 and 2010 at around 30%, key hypertension care cascade indicators - awareness, treatment and control – increased slightly from 41% to 47%; 32% to 37%; and 34% to 37% respectively [29]. Despite the availability of highly effective antihypertensive medications, the majority of hypertensive patients on treatment do not therefore achieve BP control [29].
Evidence on national hypertension prevalence in LACcs is scant. However, most studies have estimated the prevalence to be around 30%.[29] In Chile, hypertension prevalence (BP≥140/90mmHg or using antihypertensive medication) for adults aged ≥15 years in 2017 was 30%.[21]
Hypertension prevalence, and levels of uncontrolled hypertension, would be even higher if a stricter definition of hypertension based on lower thresholds for defining elevated BP is adopted. According to the 2017 American College of Cardiology/American Heart Association guidelines (2017 ACC/AHA) [32], the commonly used (seventh Joint National Committee [JNC] 7) [33] threshold for high BP (BP≥140/90mmHg) should be lowered to BP≥130/80mmHg. This change in criteria calls for a more aggressive approach to decrease the risk of CVD events occurring at lower levels of BP. The recommendation to lower BP thresholds was prompted by the findings of SPRINT (Systolic Blood Pressure Intervention Trial) which found significant reductions in the primary composite outcome (myocardial infarction, other acute coronary syndromes, stroke, heart failure, or death from cardiovascular causes) and in overall mortality among adults in the intensive treatment group (SBP target <120mmHg) versus those in the standard treatment group (SBP target <140mmHg) [34].
Lowering the BP diagnostic threshold increases hypertension prevalence and increases the number of persons eligible for antihypertensive medication. In the US, an estimated additional 31million individuals now need BP-lowering treatment due to lowering the threshold.[35, 36] As most of the hypertension research that has been conducted in LACcs predates this recommendation, the majority of studies define high BP using the BP≥140/90mmHg threshold.
Even when using the same thresholds (e.g. BP≥140/90mmHg), it is challenging to monitor, interpret and compare trends in prevalence over time, since hypertension is often defined not only using BP data but also using the information on whether survey participants are currently on BP-lowering treatment, therefore the ‘true’ prevalence and its change over time may be attributed not to changes in BP levels but to changes in the pattern of prescriptions and use of antihypertensive medication (possibly due to changes in hypertension guidelines). Participants who report the use of BP-lowering treatment are likely to have observed BP values that are lower than their “underlying” BP values.[37] This problem is common for any operational definition that includes the use of treatment to establish the prevalence of chronic diseases, for example when comparing trends in hypercholesterolemia.[38]
Data from 1975 to 2015 show that BP levels have been steadily falling worldwide except in some areas of Asia and Africa.[28] This decrease in BP could be explained partially through the increased detection by health care professionals (awareness) and subsequent wider uptake of treatments and also partially by potential decreases in a number of the major risk factors for hypertension (e.g. lower intake of salt has been reported in some countries,[39, 40] although not worldwide[41]). However, the decrease in BP levels also occurred among younger groups, where treatment coverage is often low.[42] Evidence also suggests that the falls in mean BP levels began before the recent increase in awareness and treatment levels,[28, 43] and despite the increase in several risk factors for high BP, such as high body mass index (BMI) and diabetes.[44]
Following this trend, between 2000 and 2010 hypertension prevalence (BP≥140/90mmHg or using antihypertensive medication) decreased from 28% to 26% among HICs (including Chile) but increased from 32% to 39% among LMICs.[28] Evidence from LACcs suggests diverging trends in hypertension prevalence for males and females between 2000-2010, as it increased from 27% to 33% among females (including Brazil, Argentina, Colombia, Cuba, Ecuador, Haiti, Mexico, Peru and Venezuela) but remained largely unchanged among males (around 30%).[28]
Hypertension care cascade
The key indicators of hypertension care cascade are as follows:
• Awareness (i.e. prior diagnosis of high BP or hypertension by a health care professional).
• Treatment (i.e. use of antihypertensive medication).
• Control (i.e. BP levels below thresholds such as <140/90mmHg).
Awareness levels in 2000 and 2010 for hypertensives aged ≥20 years were higher among HICs compared to LMICs: levels in Chile were similar to the former (Figure 1. 9). Levels of awareness increased from 2000 to 2010, but this varied by gender. In 2010, Chilean females had similar levels to females from other HICs. For Chilean males, however, levels were well below the 2010 average and more closely resembled the 2000 average across HICs.[19, 20, 29]
Treatment levels in 2000 and 2010 for hypertensives aged ≥20 years were higher among HICs compared to LMICs: levels in Chile were similar to the former (Figure 1. 9). Treatment levels increased from 2000 to 2010 and were higher among females.[19, 20, 29]
Control levels in 2000 and 2010 among hypertensives aged ≥20 years were higher among HICs compared with LMICs and Chile (Figure 1. 9). Control levels increased between 2000 and 2010 but only in HICs (including Chile).[19, 20, 29].
Overall in the Chilean hypertensive population, females have higher levels of awareness, treatment and control than males: reflecting at least partially gender differences in health care service utilization.[45, 46] More evidence from the Chilean national health surveys on these disparities and their change over time will be provided in the following chapters.
Figure 1. 9: Hypertension care cascade in HICs, LMICs and Chile, 2000-2010
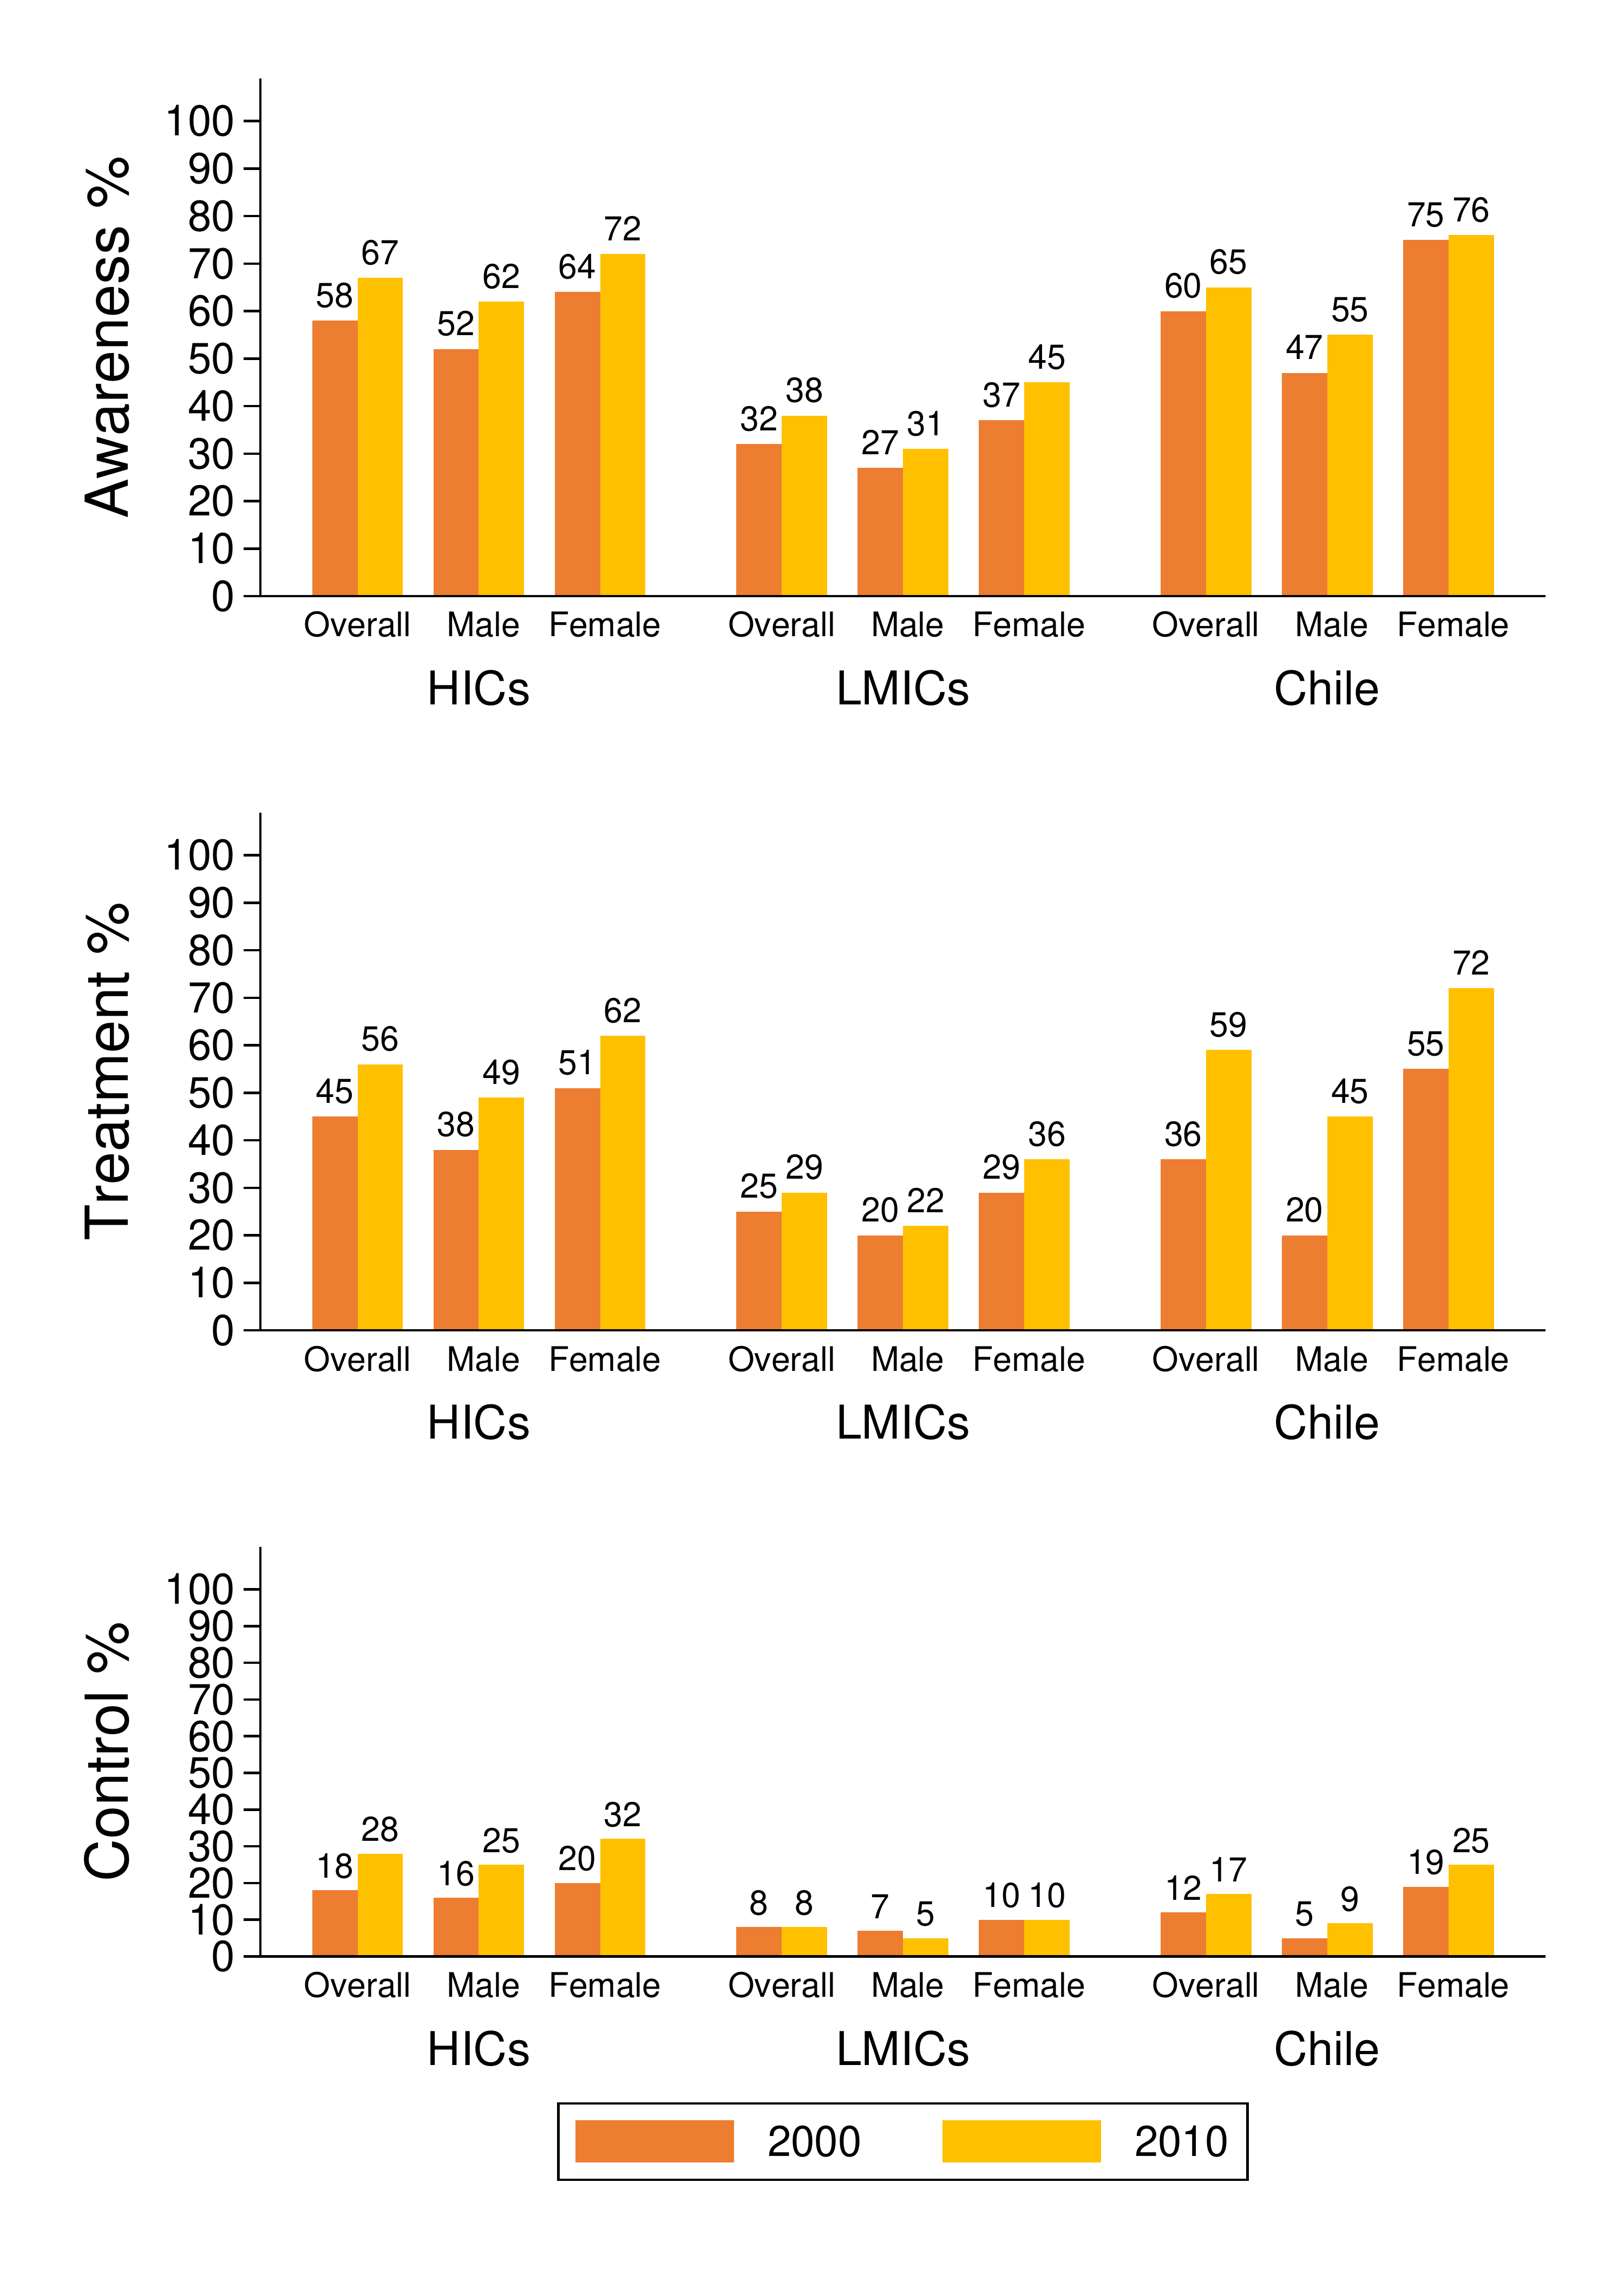
Notes to Figure 1. 9: HICs: High-Income Countries; LMICs: Low- and Middle-Income Countries. Source: HICs and LMICs: Mills et al.[29]; Chile: ENS2003, ENS2010.[19, 20]
Attainment of care cascade indicators for various diseases has been recently described for LMICs [47] and for HICs [48] using cross-sectional nationally representative health examination surveys (HES), based on the JNC 7 definition of hypertension (BP≥140/90mmHg or use of antihypertensive treatment). Geldsetzer et al. showed a prevalence of hypertension of around 30% for most Latin American and Caribbean countries, with the lowest prevalence in Ecuador (9%) and the highest in Grenada (41%); however, levels were not directly comparable due to differences in age [47]. Zhou B et al. showed higher levels of hypertension for HICs than for most LMICs, with values amongst those aged 40-79 years ranging between 33% in Australia to over 52% in Finland [48].
Recent cross-sectional analysis of Latin American data collected as part of the Prospective Urban Rural Epidemiology (PURE) study was based on 33,276 participants aged 35-70 years from urban and rural communities in six countries (Argentina, Brazil, Chile, Colombia, Peru and Uruguay). The study by Lemelas et al reported significant variations in prevalence (18-52%), awareness (52-65%), treatment (47-63%) and control (16-30%) [49]. However, the analytical sample was not fully nationally representative, and its cross-sectional design meant that no evidence could be provided on trends in these indicators over time.
As described by Mills et al [29], scientific knowledge relating to the efficacy (i.e. the power to produce a direct result or effect) and effectiveness of lifestyle modifications and BP-lowering treatments for the prevention of hypertension and other CVDs has not been fully applied to populations living in LMICs. Numerous barriers at the levels of (1) the healthcare system; (2) health care providers; and (3) patient are described by Mills et al (2016) as factors that are likely impeding the prevention and control of hypertension: such barriers include lack of access to care, costly medications, and low patient health literacy. Such barriers may also be key drivers of inequalities in health and health care within LMICs.[29]
There is scarce evidence of recent trends in the hypertension care cascade from countries such as Chile that have experienced fast epidemiologic transitions. To the best of my knowledge, no studies to date in the Latin American and Caribbean region (LAC) have quantified these trends using nationally representative, measured BP data, and only one study (in Peru) has assessed the implications of lowering the BP thresholds in line with the 2017 ACC/AHA guidelines (albeit using an indicator of high BP alone) [50].
1.2. 2. Hypertension in state policies in Chile
Policies affecting hypertension prevalence
Chile has a very strong and efficient high coverage public-health care system bringing success in indicators of maternal and infant health. Sustained efforts have been made to provide care to the hypertensive population since the 1980s [51] through its Mixed Healthcare system (public and private), with 75% of the population using public-health insurance and services in 2017 [16]. Since the 1980s, two major health system interventions were introduced to improve the care cascade of hypertension. First, in 2002, the former hypertension disease-specific programme in primary public care was transformed into an integrated risk-stratified based model: the “Cardiovascular Health Program” and second, in 2005, a law was passed (Garantías Explícitas en Salud [GES]) which warranted timely access and financial coverage (e.g. medicines free-of-charge) to all insured Chileans (public and private) for the most prevalent chronic diseases, including hypertension [52]. These efforts are aligned with the current health goals for 2010 to 2020 of increasing the level of controlled hypertension (defined as BP<140/90mmHg) in relative terms by 50% [53].
BP levels are affected by several factors. These include current and past behaviours and the social and environmental context, such as early-life conditions,[54] diet,[55] alcohol,[56] tobacco,[57] physical activity,[58] medication,[59] air pollution,[60] exposure to noise,[61] psychosocial stress,[62] socio-economic background,[63] temperature and geographical latitude.[64] In this context, the WHO outlines four main recommendations (Table 1. 1) aimed to prevent and successfully control hypertension: these cover health and lifestyle behaviours; increasing physical activity; reducing harmful alcohol consumption; stopping tobacco use and eating a healthy diet.
Table 1. 1: WHO recommended interventions aiming to prevent and control hypertension
| Intervention | Example |
|---|---|
| EATING A HEALTHY DIET | Excise tax increases |
| Replacement of trans fats with polyunsaturated fats | |
| Public awareness programme about diet and physical activity | |
| STOPPING TOBACCO USE | Salt reduction through mass media campaigns and reduced salt content in processed foods |
| Smoke-free indoor workplaces and public places | |
| Health information and warnings about tobacco | |
| Bans on advertising and promotion | |
| REDUCING HARMFUL ALCOHOL USE | Excise tax increases on alcoholic beverages |
| Comprehensive restrictions and bans on alcohol marketing | |
| Restrictions on the availability of retailed alcohol | |
| INCREASING PHYSICAL ACTIVITY |
Source: WHO (2013).[65]
The Chilean National Health Strategy (2011-2020) is aligned with these recommendations, as it aims to increase prevalence levels of protective cardiovascular factors (i.e. not smoking, being in the normal range of BMI, being physically active ≥150min/week, consuming ≥5portions/day of fruits and vegetables, achieving BP<120/80mmHg, total cholesterol <5.2mmol/L, and fasting glycaemia <100mg/dl).[66] The Chilean governments planned individual and population-based interventions targeting each WHO recommendation.[67–70] One of the main interventions over the last 20 years was the modification of the Tobacco Law (2005), which enforced more restrictions on tobacco-companies and smokers: banning tobacco advertising, increasing the size of the warning message on packages, declaring more tobacco-free public spaces, and increasing taxes.[70]
Another main intervention was the Food Labelling and Advertising Law (enacted in 2012, applied since 2016), which added stop signs onto packaged foods (Figure 1. 10), increased the taxation of sugar-sweetened beverages, and decreased children’s exposure to unhealthy foods by banning marketing, advertising and sales targeting the population aged <14 years (e.g. Kinder-chocolate).[71]
Figure 1. 10: Chilean food warning labels
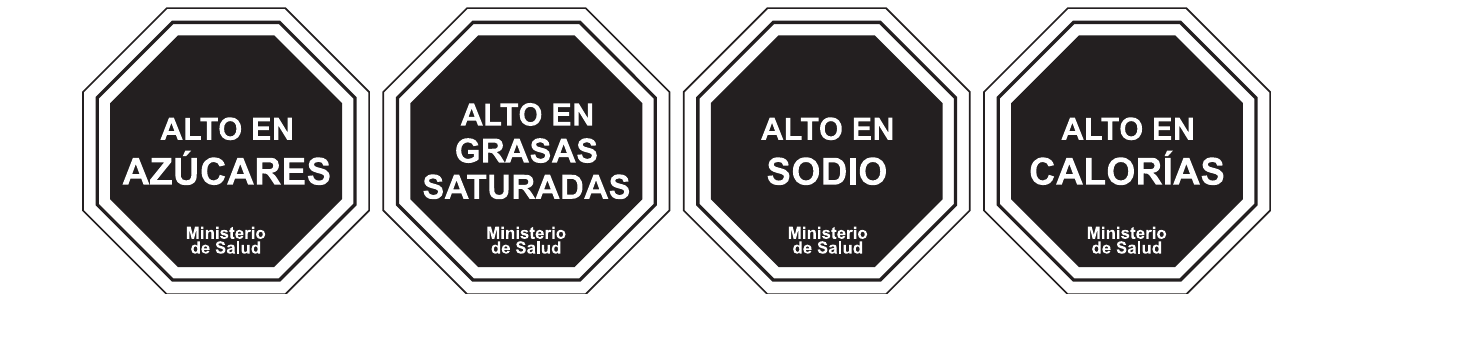 Translation: high in calories, high in saturated fat, high in sodium and high in sugar, respectively.
Source: MINSAL (2012).
Translation: high in calories, high in saturated fat, high in sodium and high in sugar, respectively.
Source: MINSAL (2012).
Chilean trends since 2003 in the major risk factors for hypertension have been mixed (Figure 1. 11). Although levels of elevated total cholesterol, high LDL, obesity and diabetes have increased, levels of current smoking and passive exposure to smoke have decreased. Meanwhile, levels of fruit and vegetable consumption, the proportion of participants with a urinary sodium-to-potassium ratio >1, and levels of alcohol consumption have remained stable.[21]
Figure 1. 11: Prevalence (%) of hypertension, risk factors and related health conditions. Chile ENS2003-2010-2017
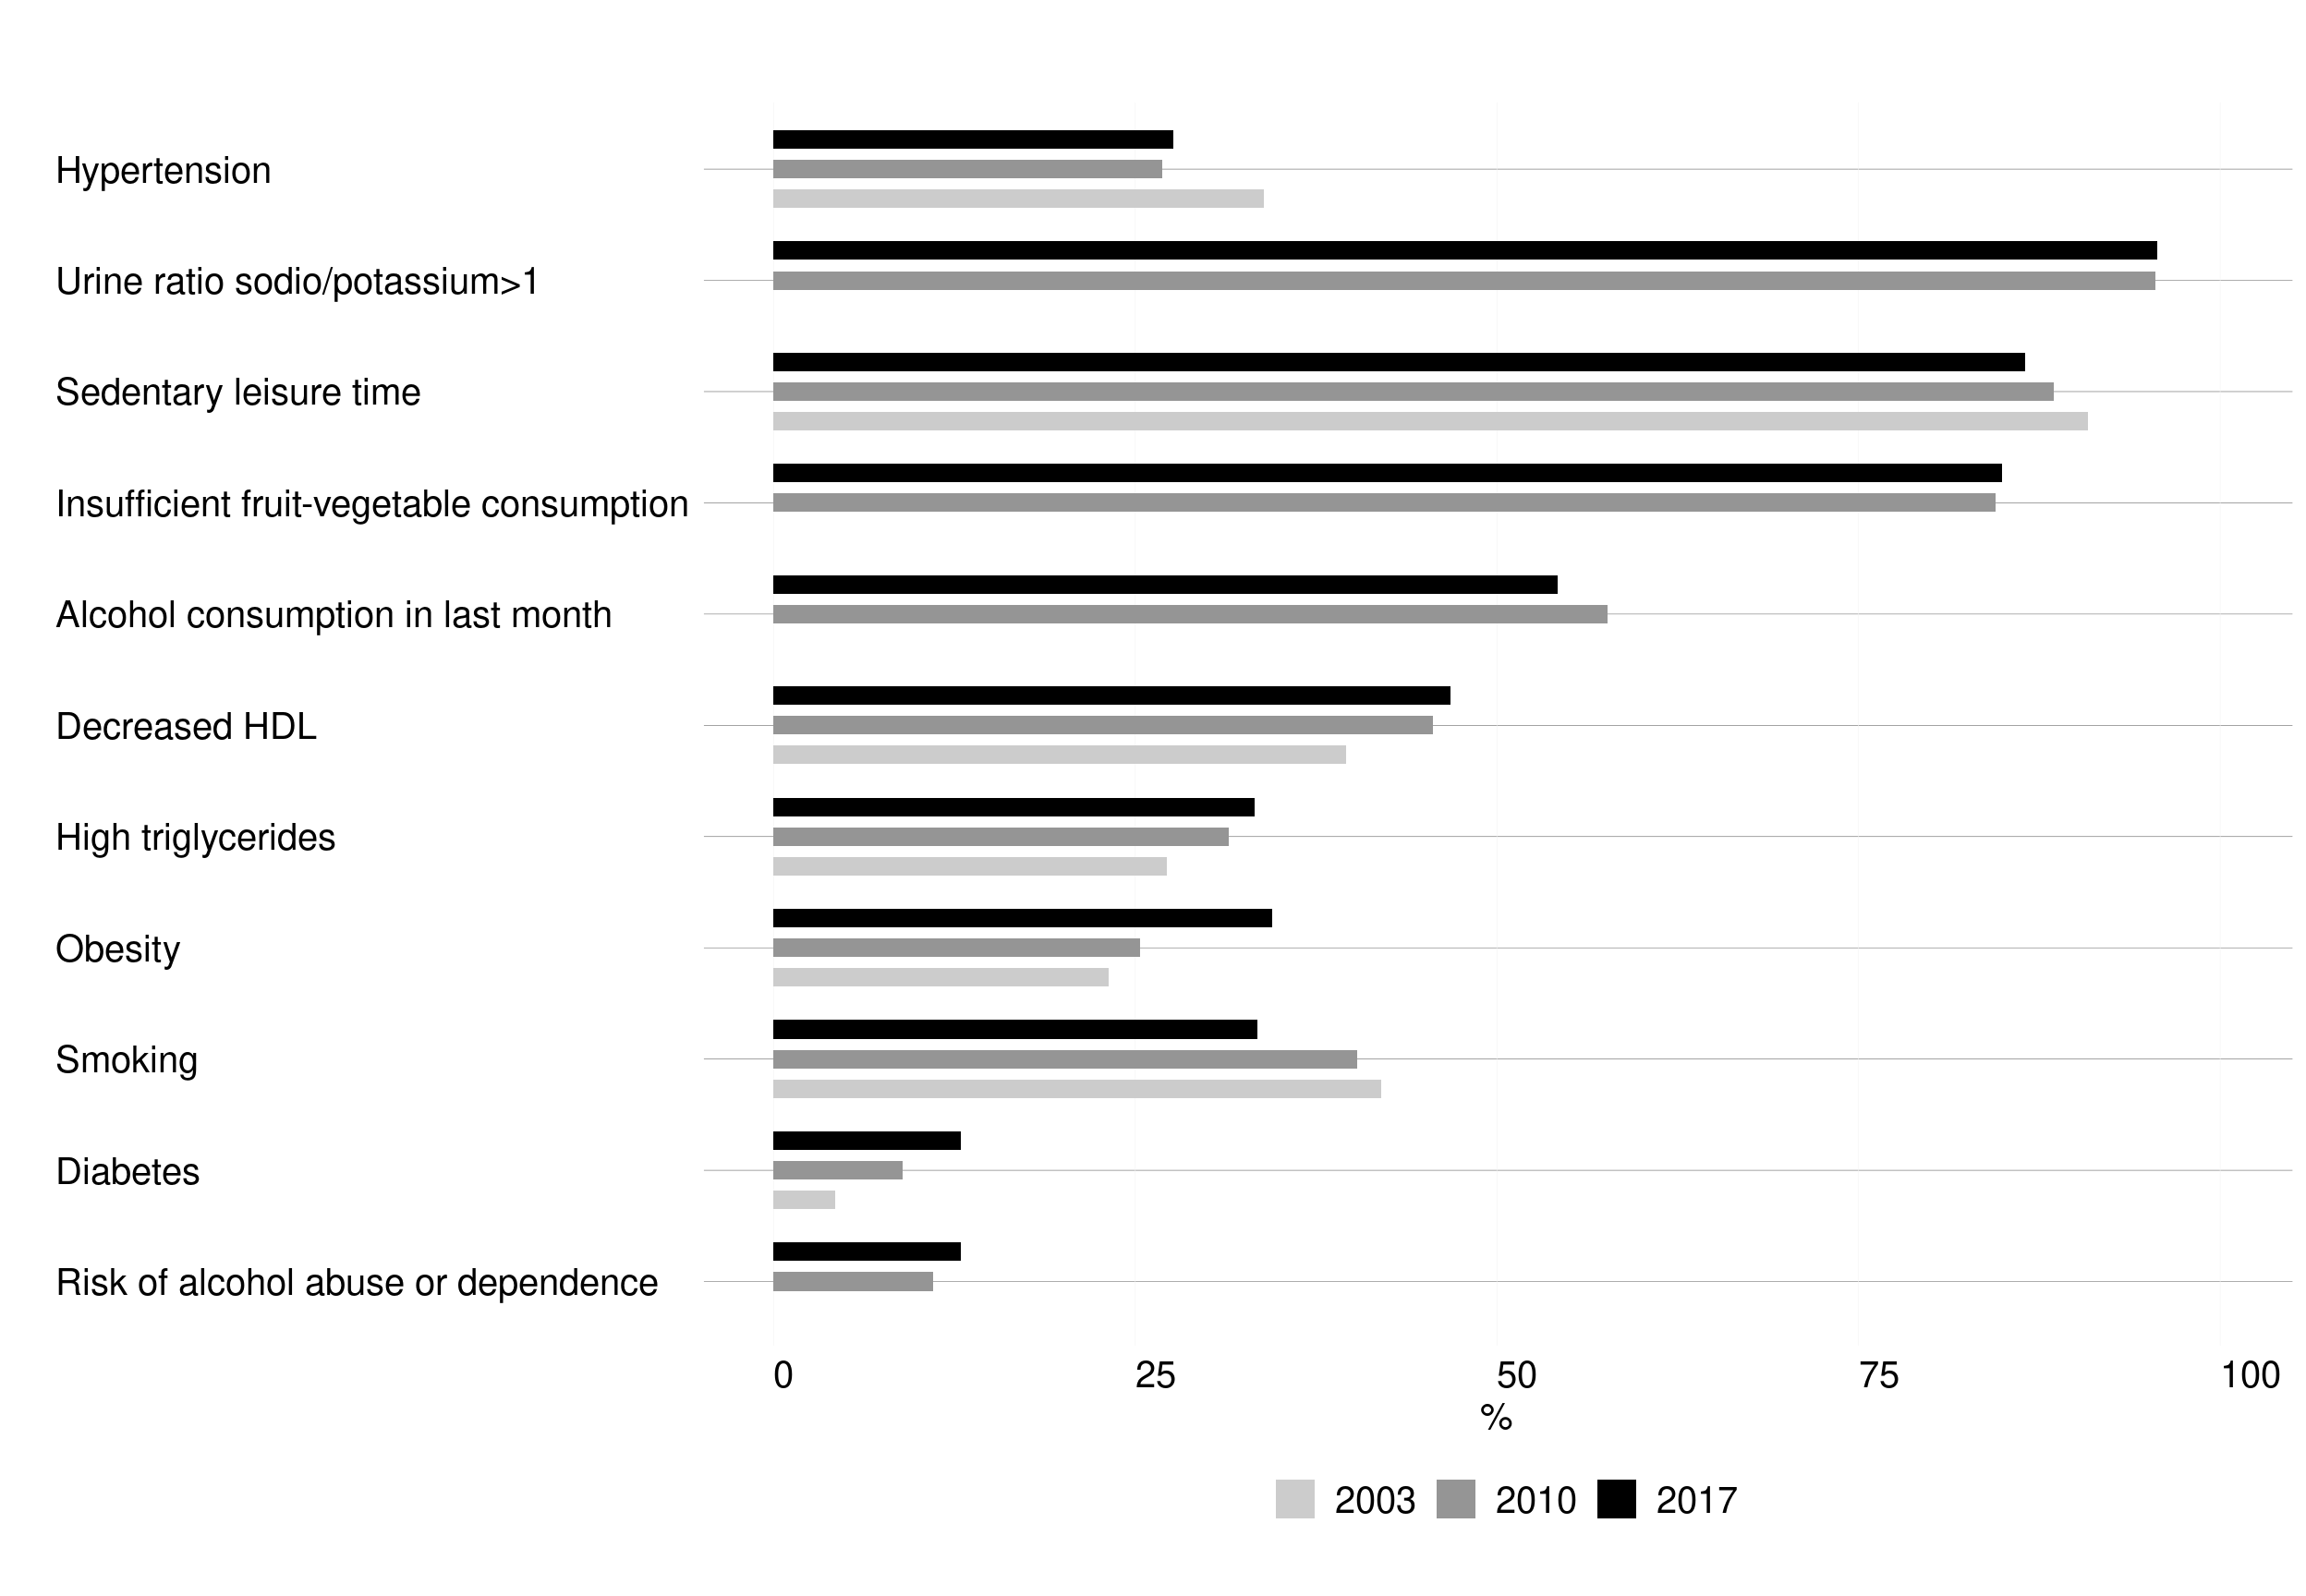
See definitions in Table A1.1 Appendix A1. Source: ENS2003, ENS2010 and ENS2017 [19–21]
Policies affecting the care cascade of hypertension
The WHO recommends integrated health programmes for hypertension and other associated non-communicable diseases (NCDs), especially at the primary care level, with trained health workers and standardised guidelines covering essential equipment (e.g. BP measurement devices); non-branded medicines; and counselling to improve treatment adherence.[72]
Following the WHO recommendations, Chile has been making sustained efforts to provide care to the hypertensive population since 1980. First, with the sub-programme of hypertension in primary care (1980-1999); secondly through the Cardiovascular Health Programme in primary care (2000-2004);[73] and lastly, through the AUGE-GES programme (2005-to the present day), described in section 1.1.2. 2.[52]
The current Chilean hypertension guidelines were published in 2010 and were developed by the Ministry of Health.[52] The guidelines address the diagnosis, treatment and follow-up of people aged ≥15 years with hypertension. They constitute a reference for the care of these patients, under the GES-hypertension programme. This guideline used the classification of the European Society of Hypertension (ESH) which defines hypertension as BP≥140/90mmHg.[74] The treatment to be initiated follows the pharmacological approach proposed by the English Hypertension Guidelines 2004.[75] The BP goals and the initial treatment (Table 1. 2) are based on the Chilean cardiovascular risk stratification, based on results from the US Framingham Heart study and adapted to the Chilean population.[76]
Table 1. 2: Blood pressure control goals and initial hypertensive treatment according to cardiovascular risk stratification, Chilean hypertension guidelines
| Cardiovascular risk stratification | Blood pressure control goal (mmHg) | Initial hypertensive treatment |
|---|---|---|
| Low cardiovascular risk | <140/90 | Changes in lifestyle |
| Low cardiovascular risk or BP ≥160/100mmHg | <140/90 | Changes in lifestyle + monotherapy antihypertensive medication |
| High cardiovascular risk or BP ≥160/100mmHg | <140/90 | Changes in lifestyle + combined antihypertensive medication |
| Very high cardiovascular risk, diabetes or proteinuric nephropathy | <130/80 | Changes in lifestyle + combined antihypertensive medication |
Note to Table 1. 2: Lifestyle changes encompass eating a healthy diet, taking regular exercise, reducing salt intake, reducing alcohol consumption and tobacco cessation. Source: MINSAL(2010).[52]
Hypertension is one of the costliest health conditions for Chile and worldwide: Chilean evidence of this high expenditure has been available since 2003 (before the introduction of the GES-Hypertension programme) and mainly reflects the costs of antihypertensive medication.[77] Costs of treatment for patients are low (£9/year/person), but high prevalence translates to high costs for the state.[78] The state pays most of the costs for patients related to hypertension: this amounts to between 80-100% of the costs of treatment depending on SEP and health insurance type.[79] Overall, 13% and 41% of the population have 90% and 100% of financial coverage, respectively.[80] Despite the availability of highly effective drugs, evidence suggests that the vast majority of hypertensives on treatment do not achieve BP control.[81] As shown earlier, ≤20% of hypertensives in Chile had their BP controlled in 2010 (Figure 1. 9).
Socioeconomic inequalities in hypertension care cascade: methodological issues
One of the aims of the GES-hypertension programme is to increase the levels of hypertension management while also decreasing socioeconomic inequalities (See Figure A1.11 in Appendix A1).[52, 66, 82, 83] Up-to-date data on the trends in hypertension management – and their inequalities - are needed to show the impact of this considerable investment.[52, 66, 84]
** I) Accounting for change in the size of SEP**
To better monitor the population health burden of disparities over time, disparity indicators should be sensitive to two sources of change: (1) change in the size of the population subgroups involved and (2) change in the level of health within each subgroup.
When the question involves only comparisons of specific groups (e.g. the richest and lowest income groups), then pairwise absolute and relative comparisons may be sufficient. When the objective is to provide a summary across all socioeconomic groups, then the use of summary measures of health disparity is warranted.
The regression-based methods outlined above, subject to the assumptions of the model, work well for calculating a summary measure of health disparity at a single point in time. As noted above, however, over time the distribution of the population in various social groups may change drastically, and it would be advantageous for a measure of health disparity to be sensitive to such changes. One measure that does so is the Slope Index of Inequality (SII).
** II) Contribution of area-level contextual factors**
Place-based characteristics have been implicated as determinants of socioeconomic inequalities in cardiovascular-related health risk factors (such as hypertension) and in the use of healthcare services (1). In Chile, one-third of adults are hypertensive (2). Chilean evidence has documented inequalities in hypertension by various measures of individual socioeconomic position (SEP). Neighbourhood markers of SEP also capture structural and social context that influences health behaviours and outcomes that are not accounted for by individual-level adjustments. However, more research is needed to assess the contribution of area-level contextual factors such as income inequality on hypertension management inequalities.
References
1.1. 1. SOCIAL DETERMINANTS OF HEALTH
Definition and framework
Recently, the Pan-American Health Organization (PAHO) Commission on Equity and Health Inequalities in the Americas adjusted the World Health Organization’s (WHO) Commission on Social Determinants of Health (SDH) conceptual framework on the “social determinants of health.” This adaptation (shown in Figure 1. 1) was done to better represent the conditions of America (as a continent), giving more emphasis to colonialism; racism; climate change; human rights; and inequities according to age, gender, sexual orientation, ethnicity and disability.[1] According to the PAHO, the SDH can be classified as (1) ‘structural drivers,’ those related to the socio-economic and political context, and (2) ‘daily life conditions,’ such as early life and education, working life, income and health systems.
Figure 1. 1: PAHO Equity Commission’s conceptual framework
Source: PAHO (2018).[1]
Health ‘inequalities’ and ‘inequities’ are related but different concepts: inequalities denote differences while inequities emphasize unfair, avoidable differences arising from poor governance, corruption or cultural exclusion. ‘Health inequities’ are systematic differences in health that could be avoided and addressing them is an issue of social justice.[2] Many types of health inequities are seen by groups of age, gender, ethnicity, religion, geographical location and by markers of socioeconomic position (SEP) such as household income, educational status, and health insurance status. Chile is one of South America’s most prosperous nations but is also one of the most income-unequal country worldwide.[3] Using the PAHO conceptual framework set out above, the following section gives a brief overview of aspects of the structural and daily-life conditions in Chile.